
As someone who has navigated the markets for over a decade, including the 2020 meltdown, I can tell you that the Hang Seng Index (HSI) is a different beast. Successful day trading Hang Seng Index products isn’t about chasing every wild swing; it’s about disciplined survival. Many new traders are drawn to its notorious price action, hoping for quick profits, but they often fail because they lack a true understanding of Hang Seng Index volatility. This guide is not about get-rich-quick schemes. It’s about providing robust, battle-tested strategies for handling its volatility, forged from years of experience at the sharp end of the market. My philosophy is simple: it’s not about winning a single trade, but surviving the whole game. Let’s dismantle the hype and build a professional approach.
What is Hang Seng Index (HSI) Volatility and Why It Matters to Day Traders
Pro Tip: Volatility is simply the statistical measure of price fluctuation. For a day trader, it’s the very environment we operate in. High volatility means greater potential reward, but it brings exponentially greater risk. Your primary job is not to predict the HSI’s every move but to manage your exposure to its violent swings. Treat volatility as the ocean’s current; you don’t fight it, you learn to navigate it.
For those of us trading intraday, Hang Seng Index volatility is a double-edged sword. On one hand, it creates the price movement necessary to generate profit within a single trading session. Without it, we would have no opportunities. On the other hand, it is the primary source of risk, capable of triggering margin calls and catastrophic losses in a matter of minutes. Understanding what makes the HSI so volatile is the first, crucial step toward building a sustainable trading career.

Defining Market Volatility in the Context of the HSI
In academic terms, volatility is the standard deviation of an asset’s returns. In a practical sense for a day trader, it manifests as several distinct market characteristics:
- Wider Spreads: The gap between the bid and ask prices widens, increasing the cost of entering and exiting a trade.
- Increased Slippage: The difference between the price at which you expect your order to be filled and the actual execution price. In volatile moments, a market order can be filled at a significantly worse price than anticipated.
- Rapid Price Swings: The HSI can move hundreds of points in a single session. These are not smooth, predictable trends but often jagged, erratic movements that can stop you out of a position before it has a chance to move in your favour.
- Gap Risk: The index can open significantly higher or lower than its previous close, driven by overnight news or events in other global markets. This is particularly pertinent for the HSI due to its sensitivity to policy announcements from mainland China.
Key Drivers of Hang Seng Index Volatility You Must Watch
The HSI’s volatility is not random; it’s a reaction to a specific set of inputs. A professional trader monitors these inputs constantly. From my experience, these are the most critical drivers:
- Mainland China’s Policy and Regulatory Environment: This is arguably the biggest factor. The HSI is heavily weighted towards Chinese companies (e.g., Tencent, Alibaba, Meituan). Any policy announcement from Beijing, whether on technology, property, or financial markets, can cause immediate and severe reactions. A trader must follow news from sources like the People’s Bank of China (PBoC) and the State Administration for Market Regulation (SAMR) as closely as they follow their charts.
- Global Macroeconomic Data: As a major international financial centre, Hong Kong’s market is deeply connected to the global economy. Key data points to watch include U.S. inflation (CPI), Federal Reserve interest rate decisions, and major economic releases from the Eurozone. A surprise in U.S. non-farm payrolls, for instance, can change global risk sentiment and send the HSI moving.
- Geopolitical Events: Tensions between the U.S. and China, regional political developments, and other global conflicts introduce uncertainty. Capital flows react to this uncertainty, and the HSI is often a proxy for investor sentiment regarding the broader Asian region.
- The Hong Kong Dollar (HKD) Peg: The HKD is pegged to the USD, a system managed by the Hong Kong Monetary Authority (HKMA). Any pressure on this peg, or significant interventions by the HKMA to defend it, can have knock-on effects on liquidity and investor confidence, directly impacting the HSI.
- Capital Flows (Southbound and Northbound): The Stock Connect programme allows international and mainland Chinese investors to trade in each other’s markets. Monitoring the daily flow of funds through these channels provides a real-time gauge of investor sentiment. A large net outflow from the HSI via the Southbound Connect can be a strong bearish signal.

Essential Instruments and Tools for Trading HSI Volatility
Pro Tip: Your trading platform is your cockpit. Having the right instruments and knowing how to read your gauges is non-negotiable. Don’t just trade the index; understand the characteristics of the specific financial instrument you are using, whether it’s futures, options, or CFDs. Each has a different risk profile.
Choosing the right product to trade is as important as your trading strategy itself. For the Hang Seng Index, derivatives are the weapons of choice for most day traders due to their inherent leverage and liquidity.
An Introduction to HSI Volatility Index (VHSI) Futures
While most traders focus on the direction of the HSI, seasoned professionals also pay attention to the ‘market’s fear gauge’—the HSI Volatility Index (VHSI). The VHSI measures the market’s expectation of 30-day volatility based on the prices of HSI options. And yes, you can trade it directly via VHSI Futures listed on the Hong Kong Exchanges and Clearing (HKEX).
Why would a day trader look at VHSI futures? Two primary reasons:
- As a Hedge: If you hold a portfolio of HSI-listed stocks and anticipate a period of market turmoil, going long on VHSI futures can act as a form of insurance. As fear and volatility spike, the value of your VHSI futures position should increase, offsetting some of the losses in your stock portfolio.
- As a Speculative Tool: You can speculate on the direction of volatility itself. If you believe the market is overly complacent (low VHSI) and ripe for a shock, you might buy VHSI futures. Conversely, if you believe a panic-driven spike in volatility is unsustainable, you might short VHSI futures, betting that calm will return.
| Feature | HSI Futures | VHSI Futures |
|---|---|---|
| Primary Bet | Direction of the Hang Seng Index (Up or Down) | Magnitude of future price swings (Volatility) |
| Typical Use | Speculation on market direction, hedging against price declines. | Hedging against volatility risk, speculation on fear/complacency. |
| Correlation to HSI | High positive correlation. | Typically negative correlation (Index falls, volatility rises). |
| Trader Mindset | ‘Where is the price going?’ | ‘How fast and erratically will the price move?’ |
Using Technical Indicators like MACD and Bollinger Bands to Spot Opportunities
Technical indicators are not crystal balls. They are mathematical derivations of price and volume that can help a trader contextualise the current market action. I rely on a few simple, robust indicators rather than cluttering my charts with dozens of esoteric tools. In a volatile market like the HSI, simplicity is key.
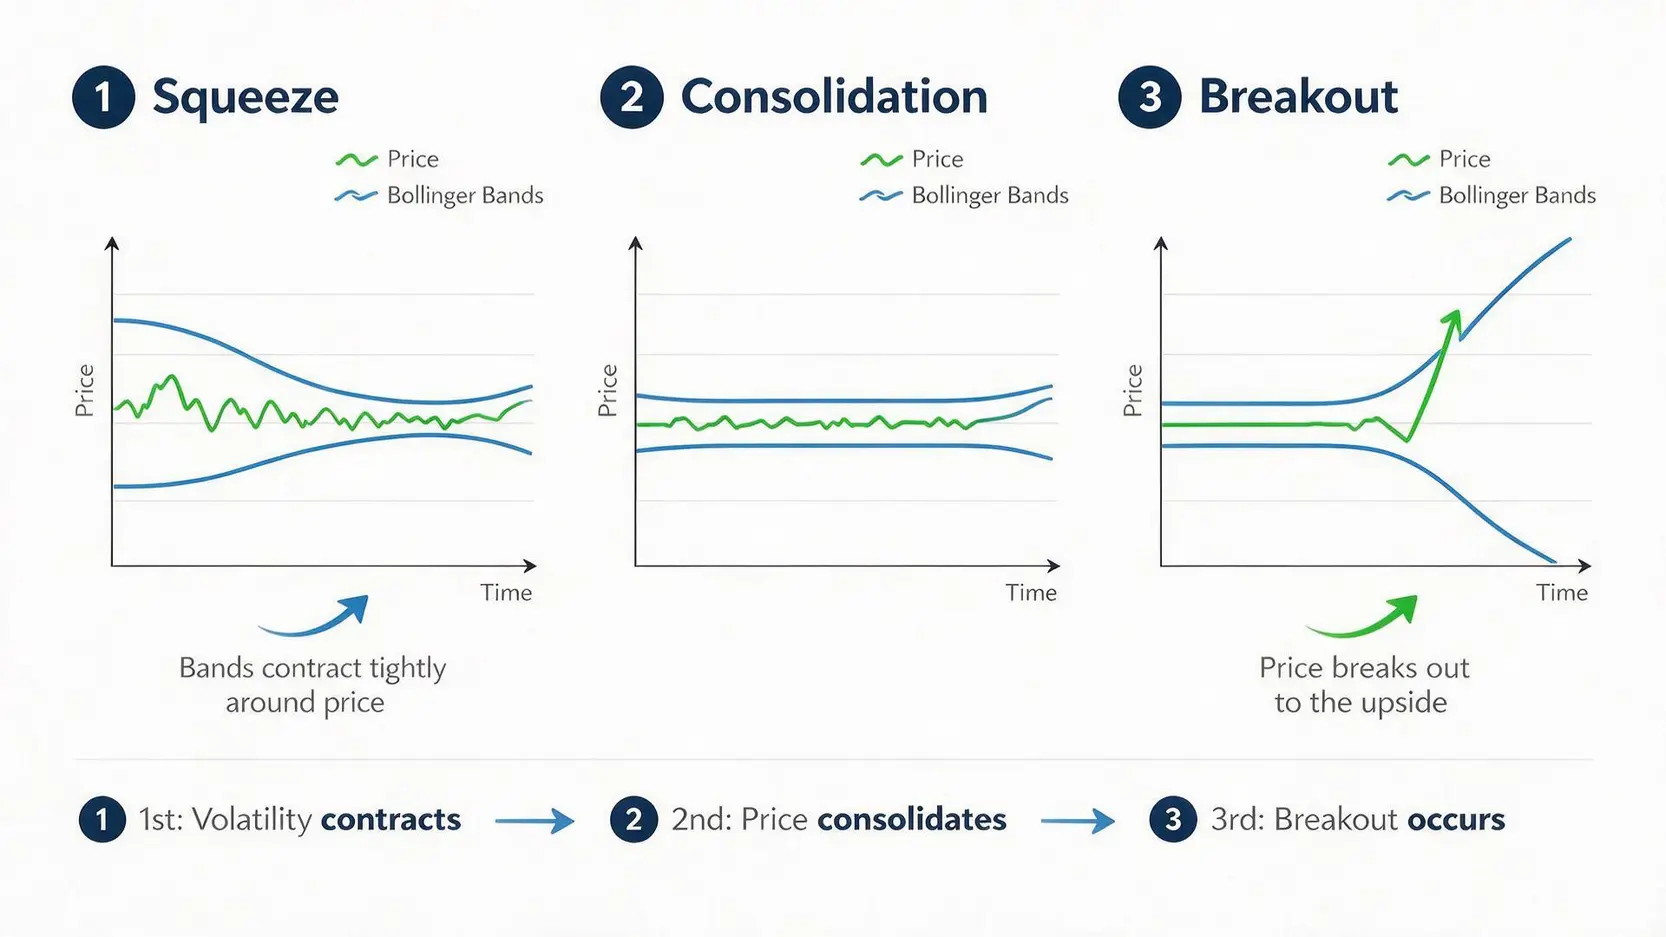
Bollinger Bands (20, 2) are my primary tool for visualising volatility. They plot two standard deviations above and below a 20-period simple moving average. Here’s how I use them:
- The Squeeze: When the bands contract and become very narrow, it indicates a period of low volatility. This is often the calm before the storm. A ‘Bollinger Band Squeeze’ is a classic setup I watch for, as it often precedes a powerful breakout. The direction is unknown, but the probability of a significant move increases dramatically.
-

Visualizing the Bollinger Band Squeeze and Breakout - Riding the Bands: In a strong, established trend, the price will often ‘walk the band,’ consistently touching the upper or lower band. A common mistake is to short the market just because the price touches the upper band. In a strong trend, this is a recipe for disaster. The price can continue riding that band for a long time.
- Reversion to the Mean: This is a more advanced technique. When price makes a sharp, explosive move far outside the bands (e.g., 3 standard deviations), it signals an extreme that may not be sustainable. I do not blindly fade (trade against) this move. Instead, I wait for a sign of exhaustion—such as a reversal candlestick pattern on a lower timeframe—before considering a mean-reversion trade back towards the 20-period moving average.
5 Actionable Tips for Day Trading Hang Seng Index Volatility
Pro Tip: Strategy without discipline is just a wish list. The following are not just ‘tips’; they are the foundational rules that have kept me in the game for over a decade. Print them out. Stick them on your monitor. They are your shield against the market’s chaos.
Theory is one thing, but execution is everything. Here are five practical, non-negotiable rules for anyone serious about day trading the HSI.
Tip 1: Identify and Trade During Peak Volatility Hours
The HSI is not equally volatile throughout the day. There are specific windows where liquidity and volume are highest, which is where the best opportunities lie for a day trader. According to the HKEX, the standard trading hours for HSI futures are divided into the day session (T session) and the after-hours session (T+1 session).
- Day Session (T): 9:15 am – 12:00 noon, then 1:00 pm – 4:30 pm (Hong Kong Time).
- After-Hours Session (T+1): 5:15 pm – 3:00 am (Hong Kong Time).
The most intense periods of volatility are typically:
- The First Hour (9:15 am – 10:15 am): This is when the market digests overnight news and order flow from the open. It’s characterised by wide ranges and sharp moves. It offers great opportunity but demands a very tight control on risk.
- The Mainland Market Open (9:30 am onwards): The opening of the Shanghai and Shenzhen stock exchanges adds another layer of volume and can often dictate the HSI’s morning trend.
- The London Open Overlap (approx. 3:00 pm – 4:30 pm): As European markets come online, a new wave of capital and participants enters the market, often leading to increased volatility into the afternoon close.
I personally avoid trading in the last 30 minutes of the lunch break (12:30 pm – 1:00 pm) as liquidity thins out, making the market prone to erratic, meaningless spikes.
Tip 2: Implement Strict Risk Management and Stop-Loss Orders
This is the most important rule. You cannot control the market, but you can control how much you are willing to lose on any single trade. Before entering any position, you must know two things: your invalidation point (where you’ll place your stop-loss) and your position size.
- The 1% Rule: I never risk more than 1% of my trading capital on a single trade. If my account is $50,000, the maximum I can lose on one idea is $500. This is non-negotiable. It ensures that a string of losses—which is inevitable—does not cripple my account.
- Use Hard Stops: A ‘mental stop’ is not a stop. It’s a hope. The HSI can move so fast that you won’t have time to react emotionally. Use your platform’s stop-loss order functionality to place a hard stop in the system the moment you enter a trade.
- Volatility-Adjusted Position Sizing: Your position size should be inversely proportional to volatility. If the Average True Range (ATR) of the HSI is high, I trade smaller. If it’s low, I can afford to trade slightly larger. The goal is to standardise the dollar amount you are risking, regardless of the market environment.
For a deeper dive into the mechanics of risk control, I always recommend the resources on Investopedia about risk management; they provide a solid theoretical foundation.
Tip 3: Leverage News and Economic Data for an Edge
Being a successful day trader in the HSI market requires you to be part-technician, part-economist. You must be aware of scheduled economic data releases. Have a calendar that shows you exactly when key data like China’s GDP, Industrial Production, or the U.S. Consumer Price Index (CPI) are due to be released. During these events, I typically do one of two things:
- Stay Flat: If I don’t have a strong conviction or a specific strategy for trading the news, I close my positions and sit on the sidelines. Trading during a major data release is gambling on a coin flip for most people.
- Trade the Post-Release Drift: Often, the initial spike after a data release is a chaotic head-fake. The real, more sustainable move often begins 5-15 minutes after the initial chaos subsides, as large institutions begin to position themselves based on the new information. I look for opportunities in this secondary move.
| Approach | Reactive Trading (Amateur) | Proactive Trading (Professional) |
|---|---|---|
| News Response | Sees a headline and immediately buys or sells. | Knows when data is due. Has a plan to either stay out or trade the aftermath. |
| Risk Management | Decides on a stop-loss after entering the trade, if at all. | Risk (stop-loss and position size) is calculated *before* the trade is placed. |
| Indicator Use | Buys when an indicator says ‘buy,’ sells when it says ‘sell.’ | Uses indicators for confirmation of a price action-based hypothesis. |
| Mindset | ‘How much can I make on this trade?’ | ‘How much can I lose? Is the potential reward worth the risk?’ |
Tip 4: Keep a Meticulous Trading Journal
Every trade you take, win or lose, is a data point. Your journal is your personal black box. It tells you what went right, what went wrong, and, most importantly, reveals the patterns in your own behaviour. A casino tracks every spin of the wheel; you must track every trade you make with the same diligence.
Your journal should include, at a minimum:
- Date and Time
- Instrument (e.g., HSI Futures)
- Setup: Why did you take the trade? (e.g., ‘Bollinger Band Squeeze breakout’)
- Entry Price, Stop-Loss Price, Target Price
- Exit Price and Reason for Exit
- Profit/Loss
- A Screenshot of the Chart at Entry and Exit
- Notes on Your Psychological State: Were you patient? Impulsive? Fearful?
Reviewing this journal weekly is where the real learning happens. You will discover that you make the same mistakes repeatedly until you consciously work to correct them. Your P&L is a byproduct of your process; the journal is where you refine that process.
Tip 5: Backtest Your Strategy Relentlessly
Never fly a plane you haven’t tested in a simulator. Before you risk a single dollar in the live HSI market, you must have data that shows your strategy has a positive expectancy. Backtesting is the process of applying your set of trading rules to historical price data to see how it would have performed.
You can do this manually, scrolling back on your charts and logging trades, or using specialised software. The goal is to gather a statistically significant sample size of trades (at least 100) to measure key performance metrics:
- Win Rate: What percentage of your trades are profitable?
- Average Win vs. Average Loss (Risk/Reward Ratio): How much do you make on average when you’re right, versus how much you lose when you’re wrong?
- Maximum Drawdown: What was the largest peak-to-trough decline in your hypothetical equity curve? This prepares you for the psychological pain of a losing streak.
If you don’t have a backtested edge, you are gambling. It’s that simple.
Frequently Asked Questions
1. What are the official trading hours for the Hang Seng Index derivatives market?
The official trading hours for Hang Seng Index futures on the HKEX are split into two sessions. The Day Session (T Session) runs from 9:15 am to 12:00 noon and 1:00 pm to 4:30 pm, Hong Kong Time. The After-Hours Trading Session (T+1 Session) runs from 5:15 pm to 3:00 am the following morning. It’s crucial to be aware of these times, particularly the volatile opening and closing periods.
2. How do HSI futures impact the volatility of the underlying index?
HSI futures have a complex, symbiotic relationship with the underlying cash index. On one hand, the futures market provides a crucial price discovery mechanism, especially during the T+1 session when the cash market is closed. This can help the cash market open more smoothly. On the other hand, the leverage available in futures can attract significant speculative flow, which can exacerbate short-term price swings and increase intraday volatility, especially around expiration dates.
3. Can you trade HSI volatility directly?
Yes. The most direct way to trade the expected volatility of the Hang Seng Index is by using HSI Volatility Index (VHSI) Futures, which are listed on the HKEX. As I mentioned earlier, these instruments allow you to take a position on whether you believe volatility will increase or decrease, and they can be a powerful tool for hedging an existing portfolio against market turbulence.
4. What is a realistic amount of capital to start day trading HSI futures?
This is a practical and vital question. While the minimum margin required by a broker for one Mini-HSI futures contract might seem low, starting with only the minimum is extremely dangerous. You need enough capital to post the initial margin, cover any potential intraday margin calls, and, most importantly, withstand a series of losses (a drawdown) without being forced out of the market. Considering the 1% risk rule and the HSI’s volatility, I would not be comfortable with anything less than $20,000 to $25,000 USD as a starting point for trading Mini-HSI futures seriously, and even then, one must be exceptionally disciplined with risk.
Danny’s Final Thoughts
Sources & Methodology
Danny strictly relies on primary regulatory data and authoritative official information to ensure accuracy. Data cited in this guide is sourced from:
- HKEX Official Site: HSI Volatility Index Futures Contract Specifications
- HKEX Official Site: Derivatives Market Trading Hours
- Hang Seng Indexes Company Limited: HSI Volatility Index (VHSI)
- Investopedia: Risk Management Techniques for Active Traders
- Hong Kong Monetary Authority (HKMA) Official Publications
*Disclaimer: The content of this article represents the personal views of the author (Danny) and is for educational and reference purposes only. It does not constitute professional investment or financial advice. Trading and investing involve significant risk; proceed with caution.*
