
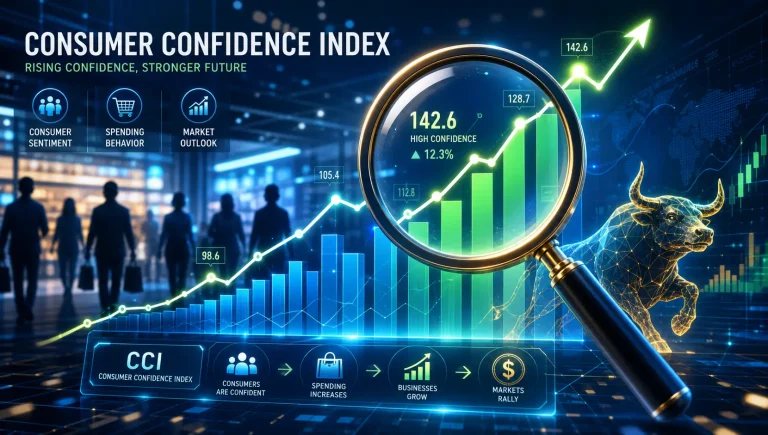
Forecasting the trajectory of the retail sector is a persistent challenge for even the most seasoned investors. As a market analyst, I’m constantly sifting through data for a definitive edge.
This brings us to a critical question: can US consumer confidence data serve as a leading indicator for retail stocks? The prevailing sentiment of the consumer, after all, directly fuels the engine of retail commerce.
This analysis will dissect the intricate relationship between these metrics, explore how to use consumer confidence to predict retail trends, and evaluate the true impact of consumer sentiment on retail stock performance.
It’s not about a crystal ball, but about leveraging macroeconomic gravity to inform psychological market movements.
The Core Thesis: Decoding the Link Between Consumer Mood and Retail Sales
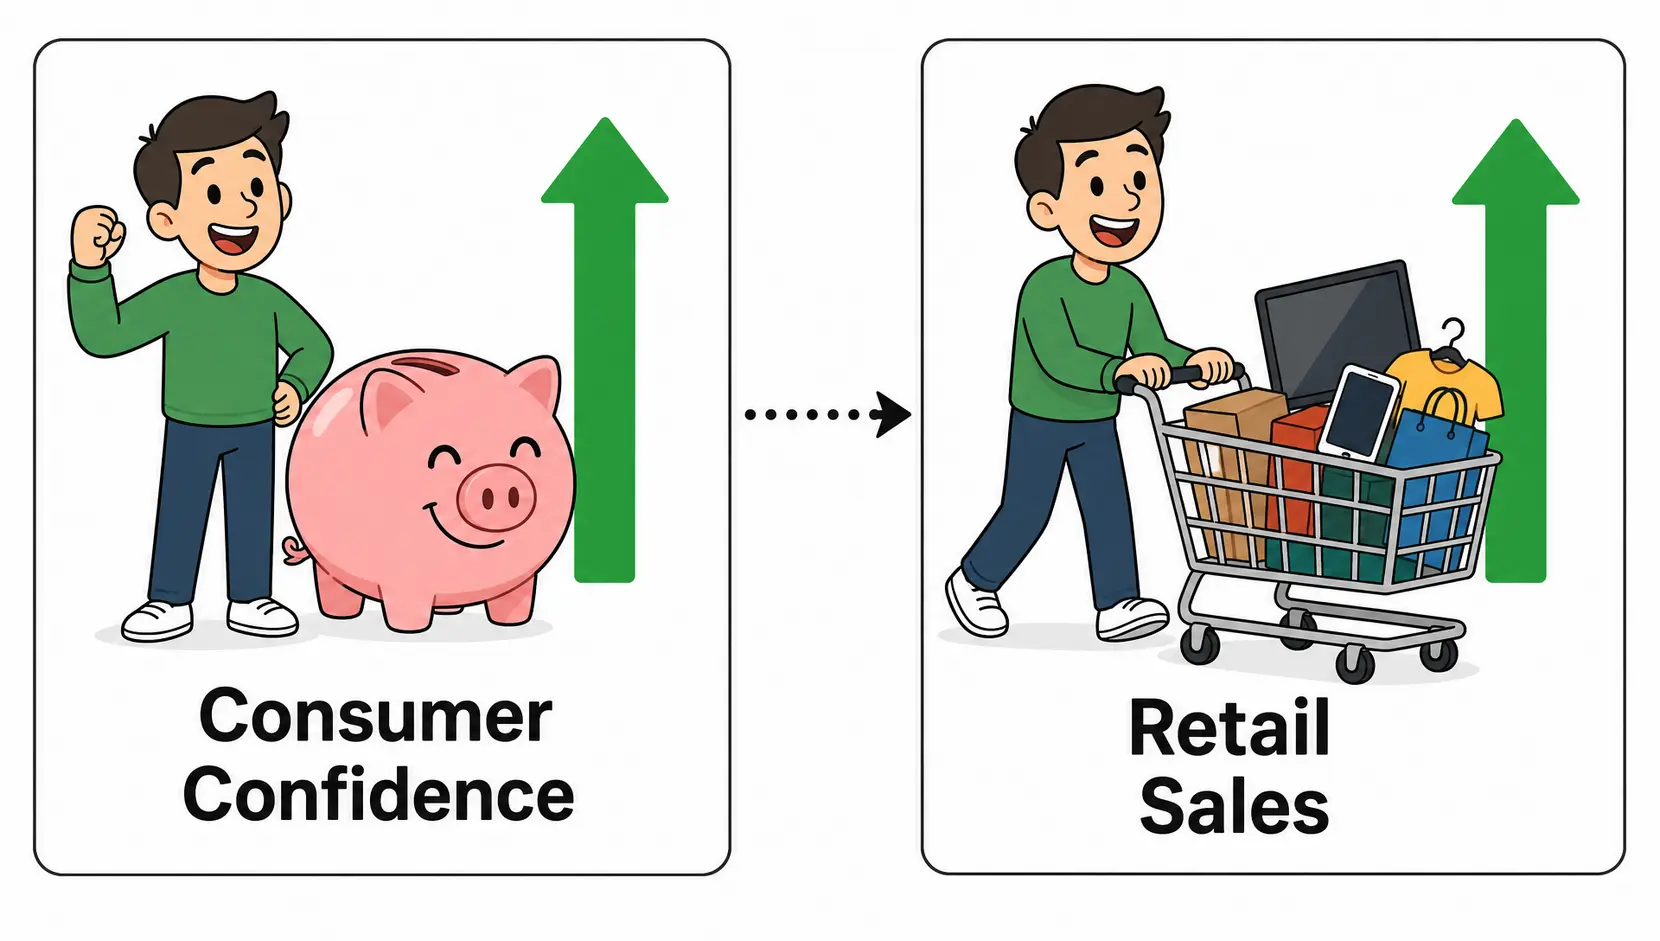
Pro Tip: The core thesis is that a confident consumer is a spending consumer. When households feel secure about their financial future and the economy, they are statistically more likely to increase discretionary spending. This directly impacts the revenue and, subsequently, the stock valuation of retail companies. Therefore, a rising trend in consumer confidence often precedes a bullish run in the retail sector.
What is the Consumer Confidence Index (CCI) and What Does It Measure?
The Consumer Confidence Index (CCI), published by The Conference Board, is a paramount macroeconomic indicator that provides a monthly snapshot of American households’ attitudes.
From my perspective, it’s one of the most direct gauges of the public’s economic disposition.
The index is not arbitrary; it’s constructed from a survey of thousands of households and is based on their perceptions of current business and labour market conditions, as well as their expectations for the six months ahead regarding business conditions, employment, and income.
It measures optimism, and in financial markets, optimism often translates into capital flow.
Why Consumer Spending is Directly Tied to Confidence Levels
The connection is fundamentally psychological. When individuals are confident about their job security and the overall economic outlook, their propensity to consume increases, particularly on non-essential, or ‘discretionary’, items.
Think of new automobiles, high-end electronics, or luxury holidays. Conversely, when confidence wanes, households tend to retrench, focusing their expenditure on ‘staples’—groceries, utilities, and basic necessities.
This behavioural shift has a profound and direct impact on the earnings reports of retail corporations.
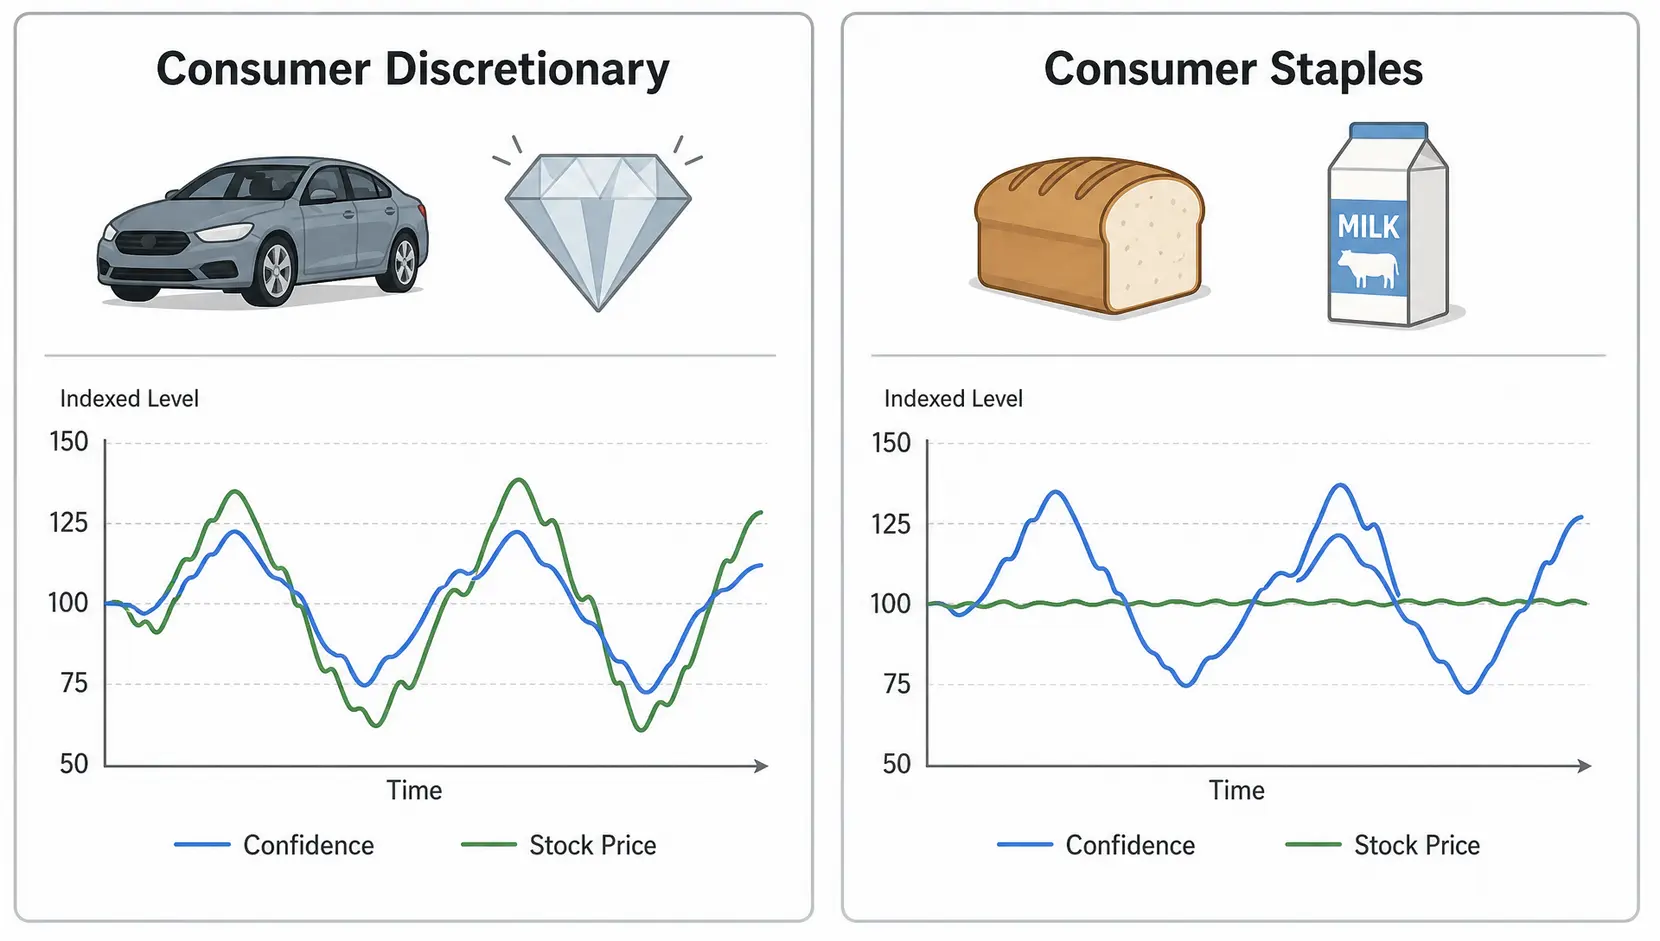
A retailer specialising in luxury goods will experience revenue fluctuations far more correlated with consumer confidence than a supermarket chain.
Leading vs. Lagging: The Great Debate on the impact of consumer sentiment on retail
| Indicator Type | Argument for Consumer Confidence | Primary Implication for Retail Stocks |
|---|---|---|
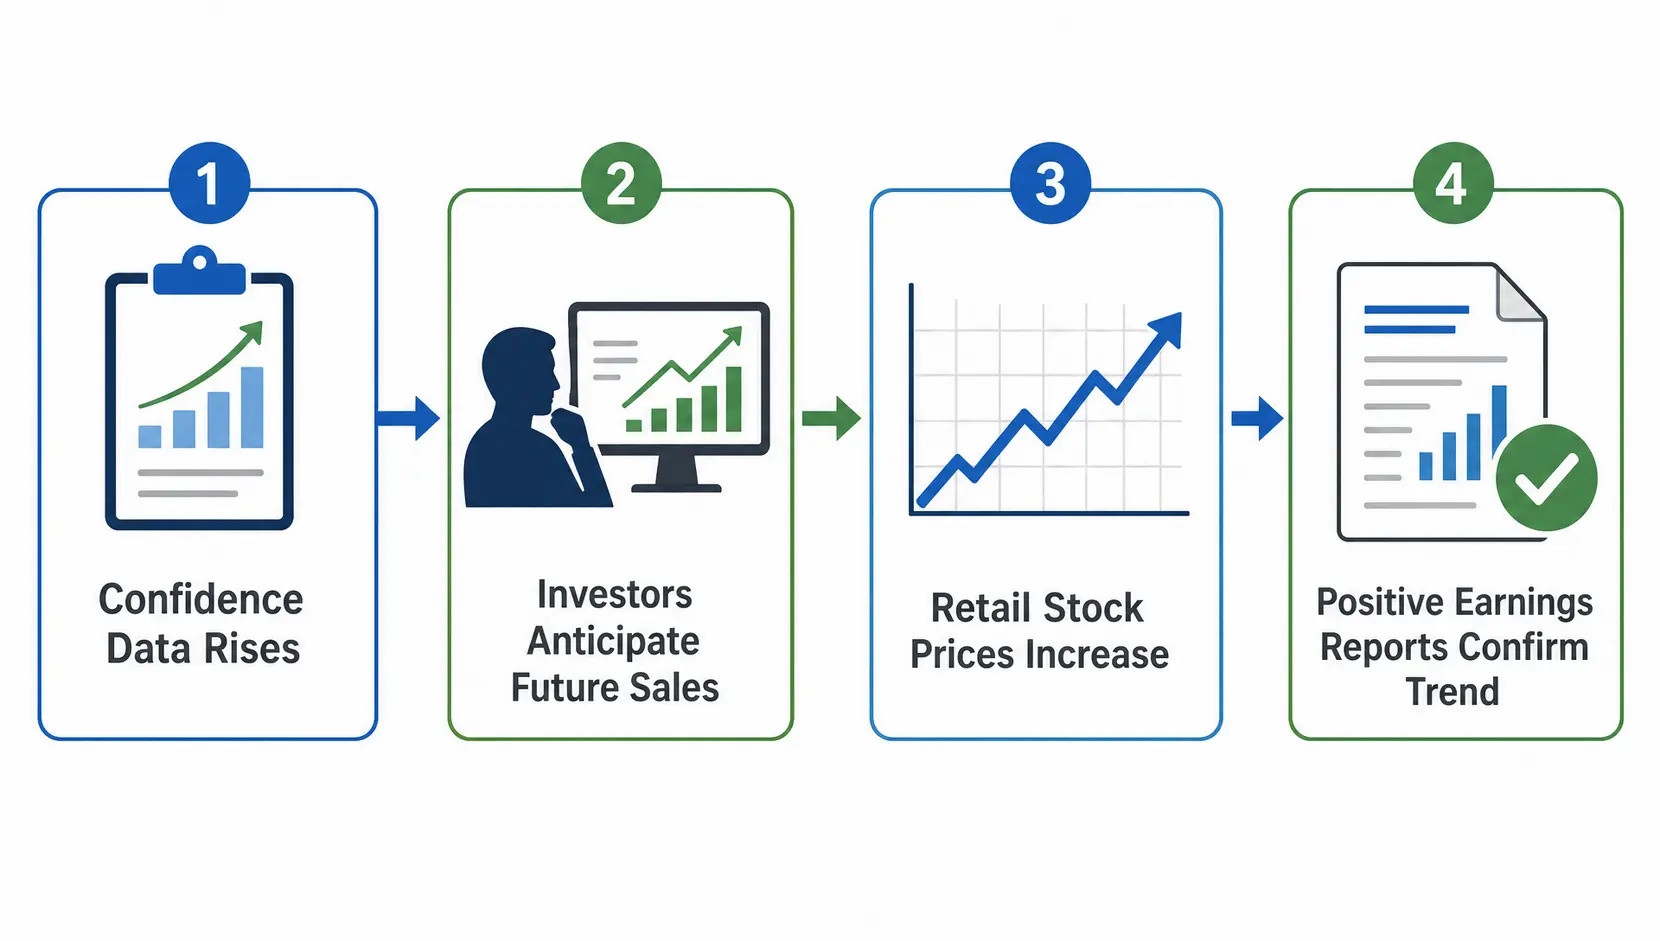
| Leading Indicator | Changes in confidence precede changes in spending habits. A rise in confidence today signals higher retail sales in the coming quarter. | Stock prices should react to confidence data releases, as future earnings are re-evaluated by the market. |
| Lagging Indicator | Consumer confidence merely reflects current economic reality (e.g., employment data, wage growth) rather than predicting it. | Stock prices will have already priced in the economic conditions that are just now being reflected in the confidence index. |
The Argument for Consumer Confidence as a Leading Indicator for Retail
The primary argument, and one I subscribe to with qualifications, is that consumer confidence is forward-looking. The survey’s ‘Expectations Index’ component specifically asks about future conditions.
An investor who tracks this data can, in theory, anticipate shifts in aggregate demand before they manifest in quarterly earnings reports.
For instance, if confidence surges in early Q3 2026 due to perceived easing of inflationary pressures, it strongly suggests that Q4 holiday season spending will be robust.
This allows an investor to establish a position in promising retail stocks *before* the positive earnings are announced and priced in by the broader market.
Counterpoint: When and Why Consumer Sentiment Might Lag the Market
One must remain objective. The counterargument holds that stock markets are themselves powerful leading indicators.
A sharp market downturn can create negative headlines that erode consumer confidence, even if the underlying economic fundamentals for that consumer (like their own job) have not changed.
In this scenario, the confidence index is simply reacting to market performance, making it a lagging or, at best, a coincident indicator. Furthermore, confidence is ‘soft’ data—it’s a measure of sentiment, not of actual transactions.
A consumer might report feeling confident but may not translate that feeling into purchases due to personal debt levels or other financial constraints.
A Practical Guide: Applying Consumer Confidence Data to Your Investment Strategy
Pro Tip: The most effective application involves trend analysis and cross-referencing. Do not react to a single month’s data point. Instead, analyse the 3-month and 6-month moving averages of the index. A sustained upward or downward trend is far more significant than a volatile monthly reading. Correlate this trend with other key indicators like Personal Consumption Expenditures (PCE) and retail sales data for a more robust signal.
Where to Find and How to Interpret Key Reports
For any serious analysis, you must go directly to the sources.
There are two benchmark reports that market professionals monitor closely:
- The Conference Board’s Consumer Confidence Index (CCI): Released on the last Tuesday of each month. This report is highly valued for its large sample size and focus on labour market sentiment. You can access the data directly from The Conference Board’s official site.
- The University of Michigan’s Consumer Sentiment Index (MCSI): This survey releases a preliminary report mid-month and a final report at the end of the month. I find its focus on personal financial expectations particularly insightful. The data is available via the University of Michigan’s Surveys of Consumers platform.
Interpreting the data requires looking beyond the headline number. A high CCI might be driven by optimism about the present situation, but if the ‘Expectations’ sub-index is falling, it signals potential trouble ahead.
This divergence is a critical nuance that can refine an investment thesis.
| Feature | The Conference Board (CCI) | University of Michigan (MCSI) |
|---|---|---|
| Release Schedule | End of month | Preliminary mid-month, Final end of month |
| Key Focus | Labour market and business conditions | Personal financial situation and inflation expectations |
| Analyst’s View | Excellent for gauging employment-driven confidence. | Better for predicting spending on high-ticket items sensitive to inflation and financing costs. |
Case Studies: Historical Correlation Between CCI and Major Retail Stocks
Observing historical data provides the clearest evidence. Let’s consider the post-Global Financial Crisis period from 2010 to 2019.
During this time, the CCI embarked on a steady, multi-year uptrend. This coincided with a major bull market in consumer discretionary stocks.
Companies like Amazon (AMZN) and Home Depot (HD) saw their valuations soar as consumers, buoyed by a recovering job market and rising asset prices, felt confident enough to spend.
Conversely, during the sharp, albeit brief, confidence plunges of 2020 and early 2022, these same stocks experienced significant volatility and drawdowns.
Academic studies, such as the analysis on the relationship between consumer sentiment and stock prices by the Federal Reserve, have consistently found a strong positive correlation. However, it’s crucial to differentiate between retail sub-sectors.
For example, shares of Consumer Staples companies (e.g., Procter & Gamble, Coca-Cola) are less correlated with confidence fluctuations. These firms sell products that are needed regardless of the economic climate.
In contrast, Consumer Discretionary stocks (e.g., luxury brands, travel companies, auto manufacturers) show a much higher correlation, making confidence data an essential tool for analysing this specific sector.
Understanding this distinction is key to applying the data effectively, as explained by Investopedia’s breakdown of the sectors.
Frequently Asked Questions
1. How is the US Consumer Confidence Index calculated?
The CCI is formulated from a monthly survey of 3,000 households.
The calculation involves creating a ‘relative value’ for each question, which is the positive responses divided by the sum of positive and negative responses.
This value is then compared against a benchmark value from 1985, which is set to 100.
The index is an aggregation of these relative values across five key areas: current business conditions, current employment conditions, expectations for business conditions in six months, expectations for employment in six months, and expectations for total family income in six months.
2. What’s the difference between The Conference Board’s CCI and the University of Michigan’s Consumer Sentiment Index?
While both measure consumer sentiment, their focus and methodology differ. The CCI by The Conference Board places a heavier emphasis on the labour market and is often seen as a better reflection of employment-driven confidence.
The University of Michigan’s index (MCSI), on the other hand, delves deeper into personal financial situations and inflation expectations, which can make it a more sensitive predictor for durable goods purchases that are often financed and thus sensitive to interest rates and inflation.
3. Which specific retail sub-sectors are most sensitive to changes in consumer confidence?
From an analyst’s viewpoint, the highest sensitivity lies within the Consumer Discretionary sector.
Sub-sectors to watch closely include: Automobiles & Components, Specialty Retail (e.g., electronics, apparel), Hotels, Restaurants & Leisure, and Household Durables (e.g., furniture, appliances).
These are purchases consumers can easily postpone when they lack confidence in their financial future. Consumer Staples, such as Food & Staples Retailing and Personal Products, are far more resilient to shifts in sentiment.
4. How far ahead can consumer confidence data predict retail stock performance?
The lead time is not fixed and remains a subject of debate. Based on historical analysis, changes in the trend of consumer confidence can precede shifts in retail stock sector performance by anywhere from three to six months.
It is not a precise timing tool for day-to-day trading but rather a strategic instrument for identifying potential medium-term (quarterly) trend changes.
Andrew Wong’s Final Thoughts
Sources & Methodology
Andrew Wong strictly relies on primary regulatory data and authoritative official information to ensure accuracy. Data cited in this guide is sourced from:
*Disclaimer: The content of this article represents the personal views of the author (Andrew Wong) and is for educational and reference purposes only. It does not constitute professional investment or financial advice. Trading and investing involve significant risk; proceed with caution.*
