

As a trader who’s been in the trenches for over a decade, I’ve seen countless beginners fixate on entry signals while completely ignoring the mechanics of their trade.
They jump into a US30 position without knowing what a single point move is worth to their account. This is a recipe for disaster.
If you don’t know how to calculate index point value in CFD trading, you cannot manage your risk, and you cannot accurately forecast your potential profit or loss.
This isn’t just about mathematics; it’s the foundation of a sustainable trading career.
Understanding the index CFD P&L formula is non-negotiable, and it’s the most critical element of your CFD trading risk management strategy.
The Core Formula: A Step-by-Step Breakdown of Point Value Calculation
Pro Tip: The definitive value for any index CFD is always found in your broker’s ‘Contract Specifications’ or ‘Product Information’ sheet. The core calculation for the value of a single point move is: Point Value = Price per Point x Contract Size. This tells you exactly how much your P&L will change for every 1.0 point the index moves.
Before you can confidently apply this formula, you must grasp its individual components. Many traders, even those with some experience, use terms like ‘point’ and ‘tick’ interchangeably, which is a critical error.
Each term has a precise meaning, and misunderstanding them leads to miscalculated risk and unexpected losses. Let’s break them down from a practical standpoint.
Understanding the Components: Point vs. Tick vs. Contract Size Explained
In the world of index CFDs, precision is everything. These terms are the building blocks of every trade calculation you’ll make. Getting them right from the start prevents costly mistakes later on.
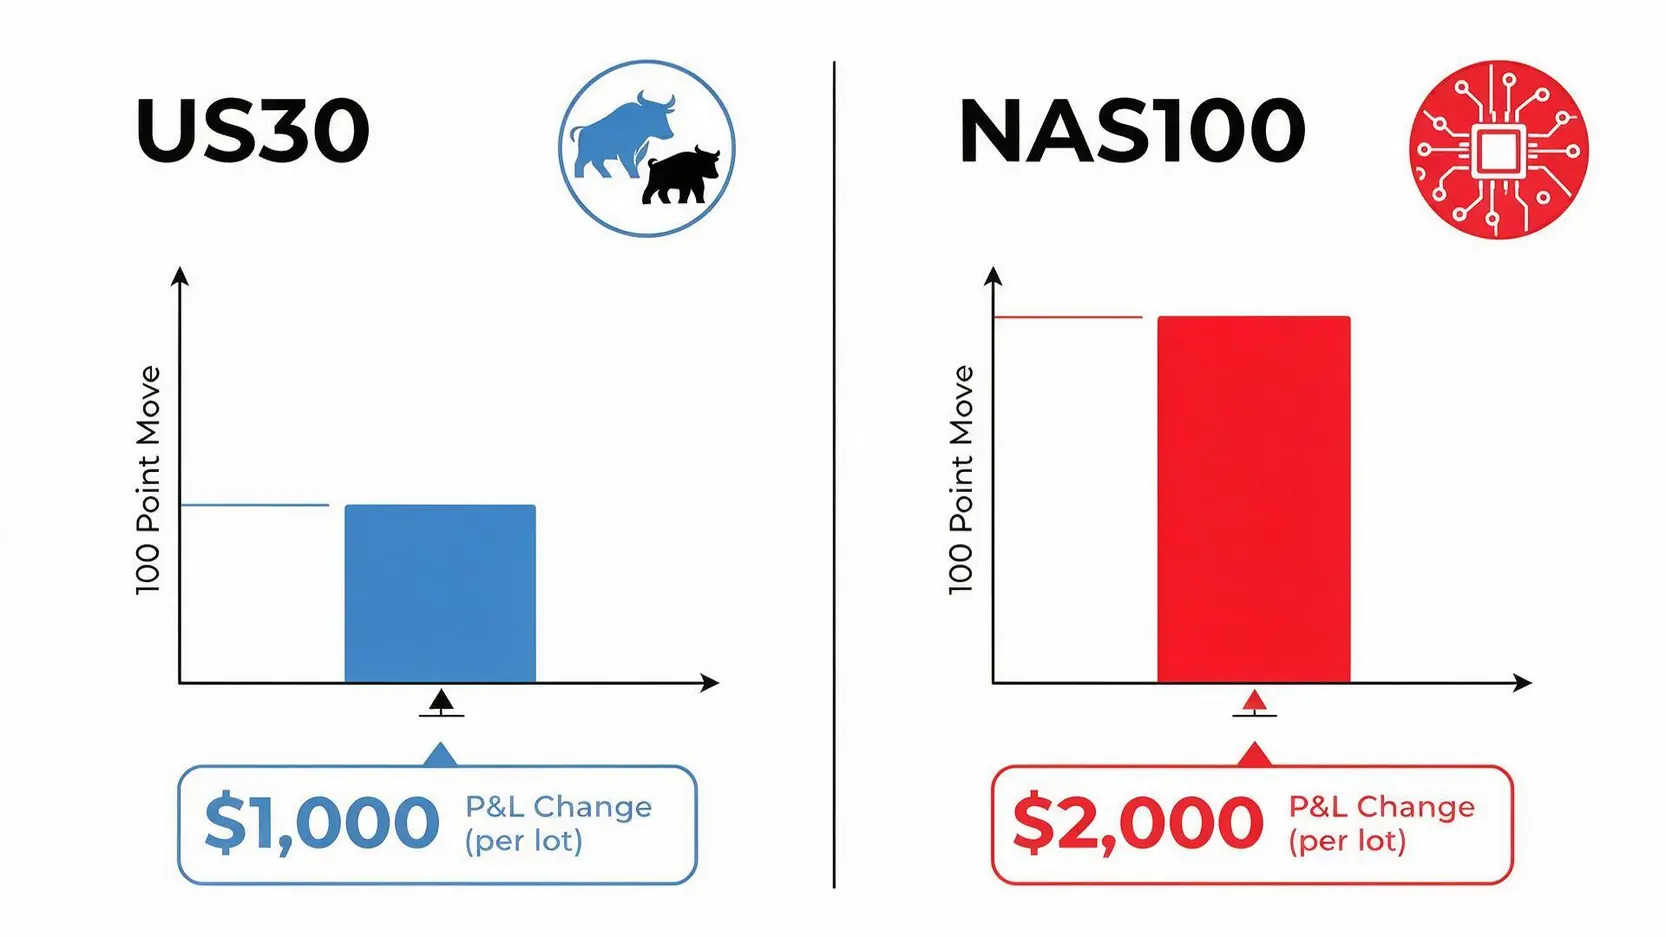
‘I remember a trader during the 2020 market drops who confused the point value on the NAS100 with the US30. He oversized his position thinking a 100-point move was a small risk, but the higher point value of the NAS100 contract meant his loss was ten times what he expected. He was wiped out on a single trade. Do not be that trader. Know your terms.’ – Danny
| Term | Definition for Index CFDs | Practical Example (Illustrative) |
|---|---|---|
| Point | A ‘point’ represents a price change of 1.0 in the underlying index. It is the integer part of the price quote. For instance, if the US30 moves from 39,000 to 39,001, that is a one-point move. | US30 is quoted at 39,545.5. The ‘5’ is the point unit. |
| Tick | A ‘tick’ is the smallest possible price fluctuation of an instrument. It represents the value of a move in the smallest decimal place of the price quote. For many indices, the tick size might be 0.1, 0.25, or 1.0. If the tick size is 1.0, then a tick and a point are the same. | NAS100 is quoted at 19,850.25. A move to 19,850.50 is one tick move (if tick size is 0.25). |
| Contract Size (Lot) | This is a multiplier defined by your broker that determines the monetary value of each point move. It’s often expressed as ‘1 Lot’ or ‘1 Contract’. For index CFDs, this might be £1, $10, or another value per point. | If 1 contract of GER40 has a point value of €25, your P&L changes by €25 for every point the index moves. |
For a definitive explanation on the nuances between these terms, I recommend reading this external guide from a trusted source: Pips, Points, & Ticks by Investopedia.
The P&L Formula: Calculating Your Profit and Loss in a Trade
Once you understand the components, the Profit and Loss (P&L) calculation becomes straightforward. This formula is the engine room of your trading analysis, allowing you to quantify risk and reward before you ever click the ‘buy’ or ‘sell’ button.
The Universal P&L Formula:
Gross P&L = (Exit Price - Entry Price) x Point Value per Contract x Number of Contracts
For a long (buy) trade, a positive result is a profit. For a short (sell) trade, a negative result is a profit. Some platforms simplify this to just `Number of Points x Point Value x Quantity`.
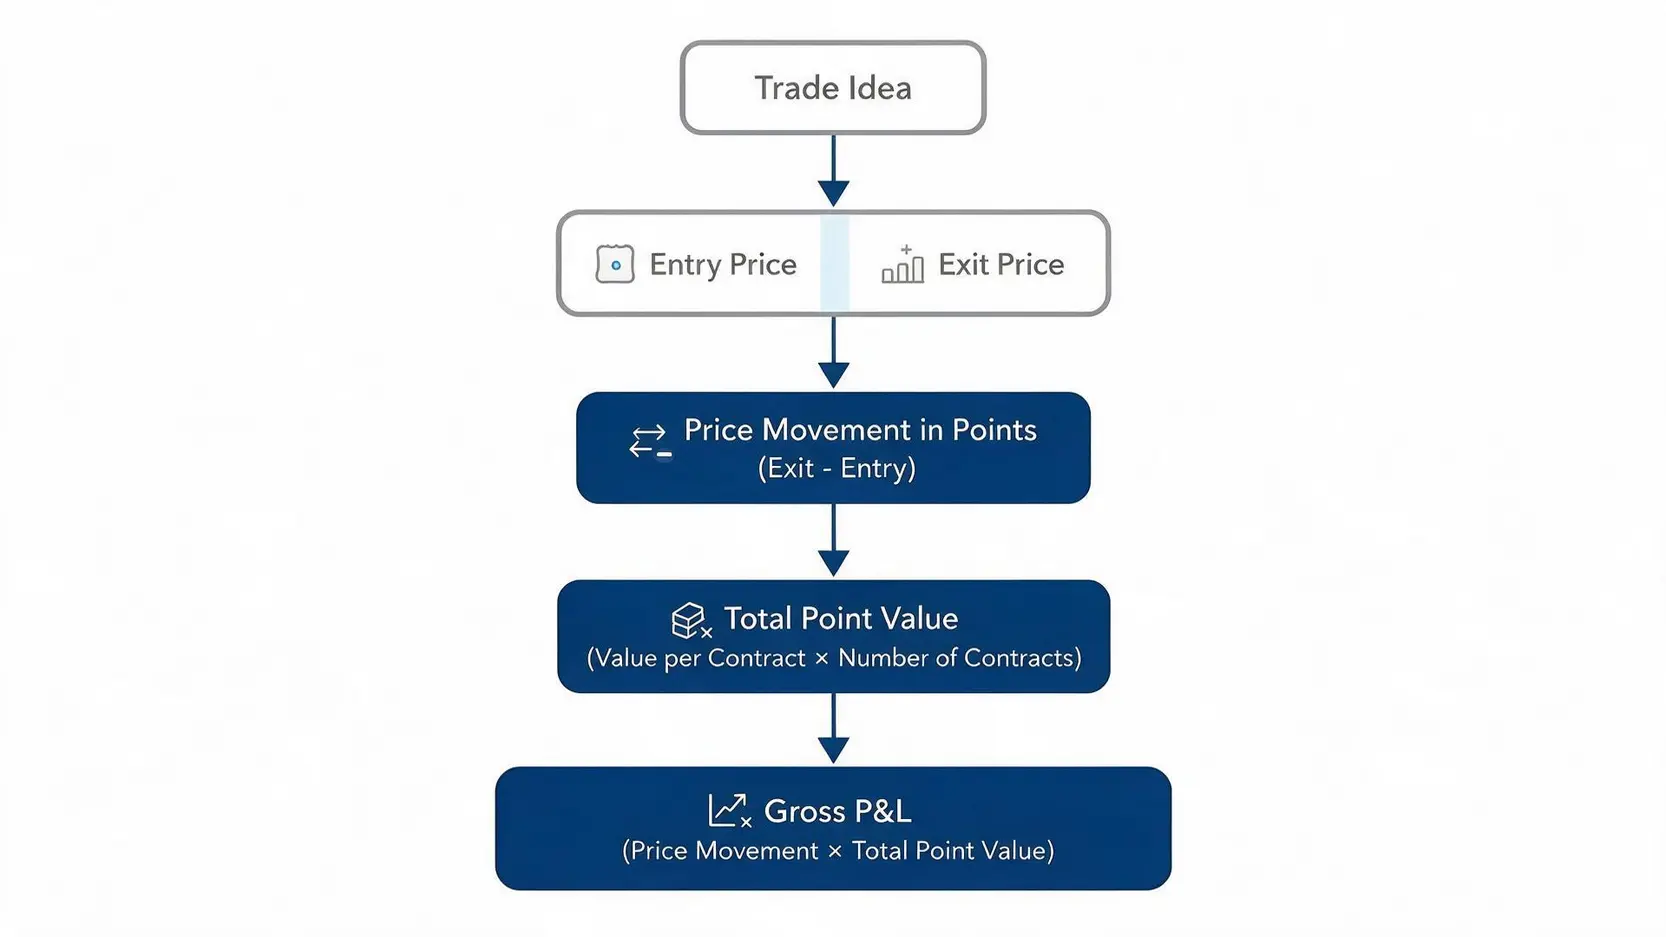
Scenario Simulation:
- You decide to buy 2 contracts of the US30 index.
- Your broker’s specification sheet states the value per point is $5 per contract.
- Your entry price is 39,500.0.
- The market rallies, and you close your position at 39,550.0.
Calculation:
- Price Movement in Points: 39,550.0 (Exit) – 39,500.0 (Entry) = +50 points.
- Total Point Value: $5 (Value per Contract) x 2 (Contracts) = $10 per point.
- Gross Profit: 50 points x $10 per point = $500.
This calculation ignores costs like spread and overnight financing for simplicity, but it demonstrates the direct relationship between market movement and your account balance.
Practical Application: Calculating for Real-World Indices
Pro Tip: Never assume the point value is the same across different indices or brokers. The point value for the NAS100 is often significantly higher than for the US30 or GER40. Always verify these details in your trading platform before executing a trade.
Theoretical knowledge must be grounded in real-world application. Major global indices like the US30 (Wall Street), NAS100 (US Tech 100), and GER40 (Germany 40) have unique contract specifications.
These differences have a material impact on your risk exposure and potential return.
How to Find and Use Contract Specifications from Your Broker (US30, NAS100 Examples)
Every regulated broker is obligated to provide a detailed breakdown of their CFD offerings. This is typically found in a ‘Contract Specifications’, ‘Market Information’, or ‘Instrument Details’ section of their website or platform.
This document is your source of truth. For an example of what to look for, you can see how institutional brokers lay this out here: CFD Contract Specs from Interactive Brokers.
Let’s create a comparative table based on typical specifications you might find at a UK-based CFD provider. Note that these are illustrative values for 2026 and must be verified with your specific broker.
| Feature | US30 (Wall Street) | NAS100 (US Tech 100) | GER40 (Germany 40) |
|---|---|---|---|
| Underlying Index | Dow Jones Industrial Average | NASDAQ 100 | DAX Performance Index |
| Currency | USD | USD | EUR |
| Price per Point (Typical 1.0 Lot) | $10 per point | $20 per point | €25 per point |
| Smallest Price Move (Tick Size) | 1.0 | 0.25 | 1.0 |
| Tick Value (for 1.0 Lot) | $10 (as Tick Size is 1.0) | $5 (because $20 per point / 4 ticks per point) | €25 (as Tick Size is 1.0) |
The Unbreakable Link: Point Value and Professional Risk Management
Core Principle: Your risk per trade should be a small, fixed percentage of your total trading capital (e.g., 1-2%). Knowing the point value is the only way to translate this percentage into a concrete trade volume (lot size). This is the essence of professional position sizing.
This is where everything comes together. Calculating point value isn’t an academic exercise; it’s the bridge that connects your risk management rules to your actions in the market.
It dictates your position size, which is arguably the single most important factor in long-term survival.
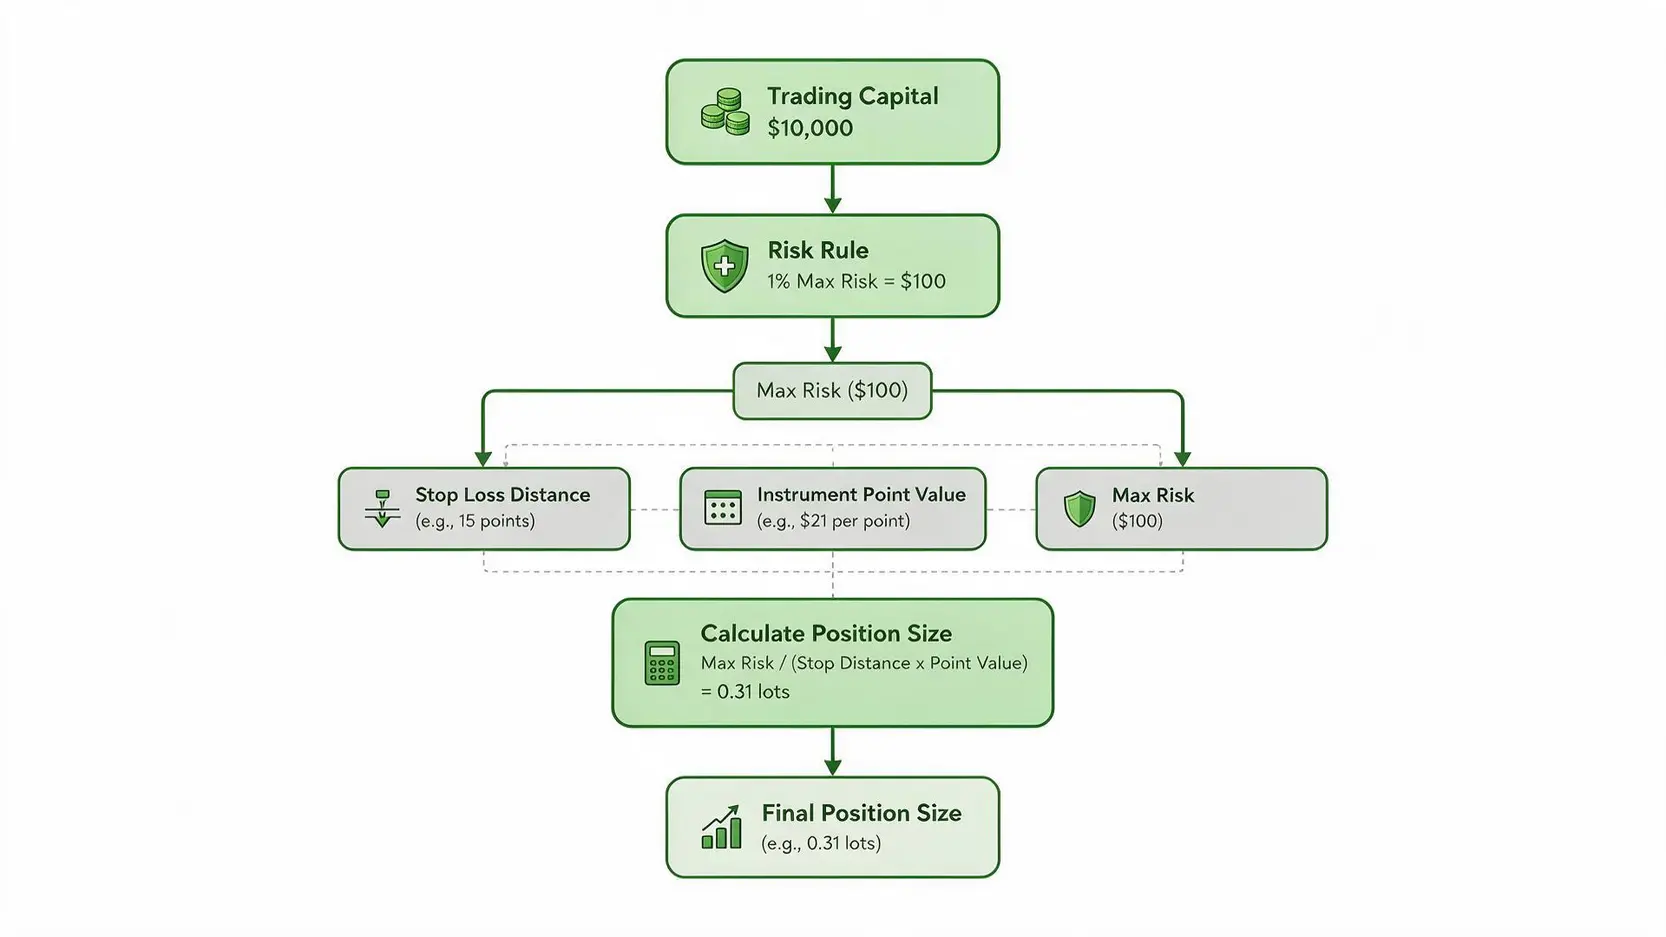
Let’s run a risk-first scenario:
- Trading Capital: £10,000
- Maximum Risk per Trade: 1% of capital = £100
- Instrument: GER40
- Point Value: €25 per 1.0 lot (let’s assume EUR/GBP is roughly 0.85, so ~£21.25 per point)
- Trade Idea: Go long, with a Stop Loss set 15 points below your entry price.
The Question: How many lots can you trade while honouring your £100 maximum risk?
Calculation:
- Risk per Lot in Pounds: 15 points (stop distance) x £21.25 (value per point) = £318.75 risk for one full contract.
- Position Size Calculation: Maximum Allowed Risk / Risk per Full Lot = £100 / £318.75 = 0.31 lots.
To stay within your 1% risk limit, you should trade approximately 0.30 lots. If you had blindly traded a standard 1.0 lot, your potential loss would have been over three times your acceptable limit.
This is how disciplined traders protect their capital, while amateurs gamble.
Frequently Asked Questions
1. What is the difference between a point and a tick in index CFDs?
Think of it like currency. A ‘point’ is the pound (£1), representing a whole number movement (e.g., 18,500 to 18,501). A ‘tick’ is the pence (1p), representing the smallest possible price change.
For some indices like the US30, the smallest move is 1.0, so a point and a tick are the same. For others, like the NAS100, the price might be quoted to two decimal places and move in 0.25 increments.
In that case, four ‘ticks’ make up one ‘point’. Always check your broker’s contract specifications.
2. How does contract size affect my potential profit and loss?
Contract size is a direct multiplier on your P&L. If a 1.0 contract (or ‘lot’) has a point value of £10, a 0.5 contract will have a point value of £5, and a 2.0 contract will have a point value of £20.
Doubling your contract size doubles both your potential profit and your potential loss for the same price movement.
This is why position sizing, based on a clear understanding of the point value, is fundamental to risk control.
3. Are index point values standardized across all trading platforms?
Absolutely not. This is a dangerous assumption. While the underlying indices (like the actual NASDAQ 100) are global, the CFD products based on them are created by brokers.
Brokers can set their own contract sizes, multipliers, and thus, point values. A 1.0 lot contract on the NAS100 might be worth $10 per point at Broker A, but $20 per point at Broker B.
There is no universal standard, which is why you must verify this information on your own platform before every trade.
4. How does the index currency affect my P&L?
If you are trading an index denominated in a different currency from your account’s base currency (e.g., trading the GER40 in EUR from a GBP-based account), your final profit or loss will be subject to currency conversion.
A €500 profit will be converted to GBP at the prevailing exchange rate when you close the trade.
This can slightly alter your final P&L, either favourably or unfavourably. Most platforms handle this automatically, but it’s a factor to be aware of.
Danny’s Final Thoughts
Forget about fancy indicators or secret strategies for a moment. If you take one thing away from this, let it be this: mastering the calculation of point value is the most crucial step toward becoming a disciplined, risk-aware trader. It transforms trading from a guess into a calculated business decision. It’s the boring, unglamorous work that keeps you in the game long enough to see success. Do the maths, respect the risk, and the market will respect you in return.
Sources & Methodology
Danny strictly relies on primary regulatory data and authoritative official information to ensure accuracy. Data cited in this guide is sourced from:
*Disclaimer: The content of this article represents the personal views of the author (Danny) and is for educational and reference purposes only. It does not constitute professional investment or financial advice. Trading and investing involve significant risk; proceed with caution.*
