
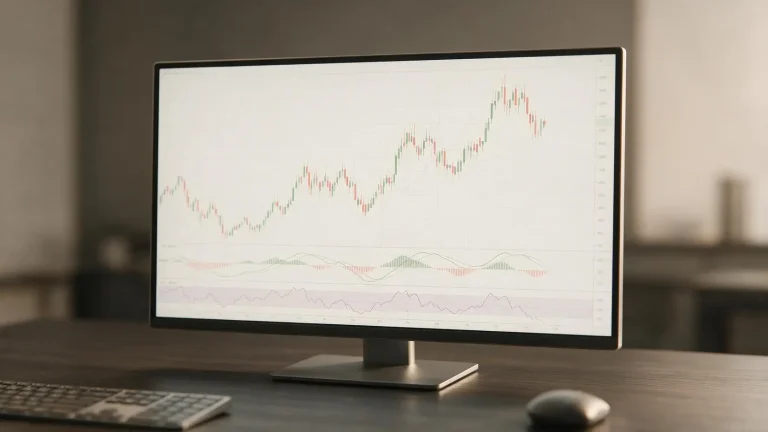
Staring at a Dow Jones Industrial Average (DJIA) chart for the first time can feel like trying to read a foreign language. The erratic lines, colourful bars, and oscillating graphs are enough to intimidate anyone. My first decade trading through events like the 2015 flash crash taught me that beneath this complexity lies a logical framework. This guide provides a foundational approach to Dow Jones Index technical analysis, demystifying the process. We will explore how to perform technical analysis for the Dow Jones and dissect the essential chart patterns that matter. My goal isn’t to give you a magic formula, but a robust methodology to interpret market sentiment directly from the price chart.
What is Technical Analysis for the Dow Jones Index?
When we apply technical analysis to the Dow Jones Industrial Average (DJIA), we are essentially studying the supply and demand dynamics of the 30 blue-chip stocks that constitute the index. Instead of dissecting each company’s balance sheet, we scrutinise the index’s price chart to identify patterns, trends, and momentum shifts. This methodology is built upon a century-old framework that remains surprisingly relevant in today’s high-speed markets.
The Core Principles: Dow Theory Explained
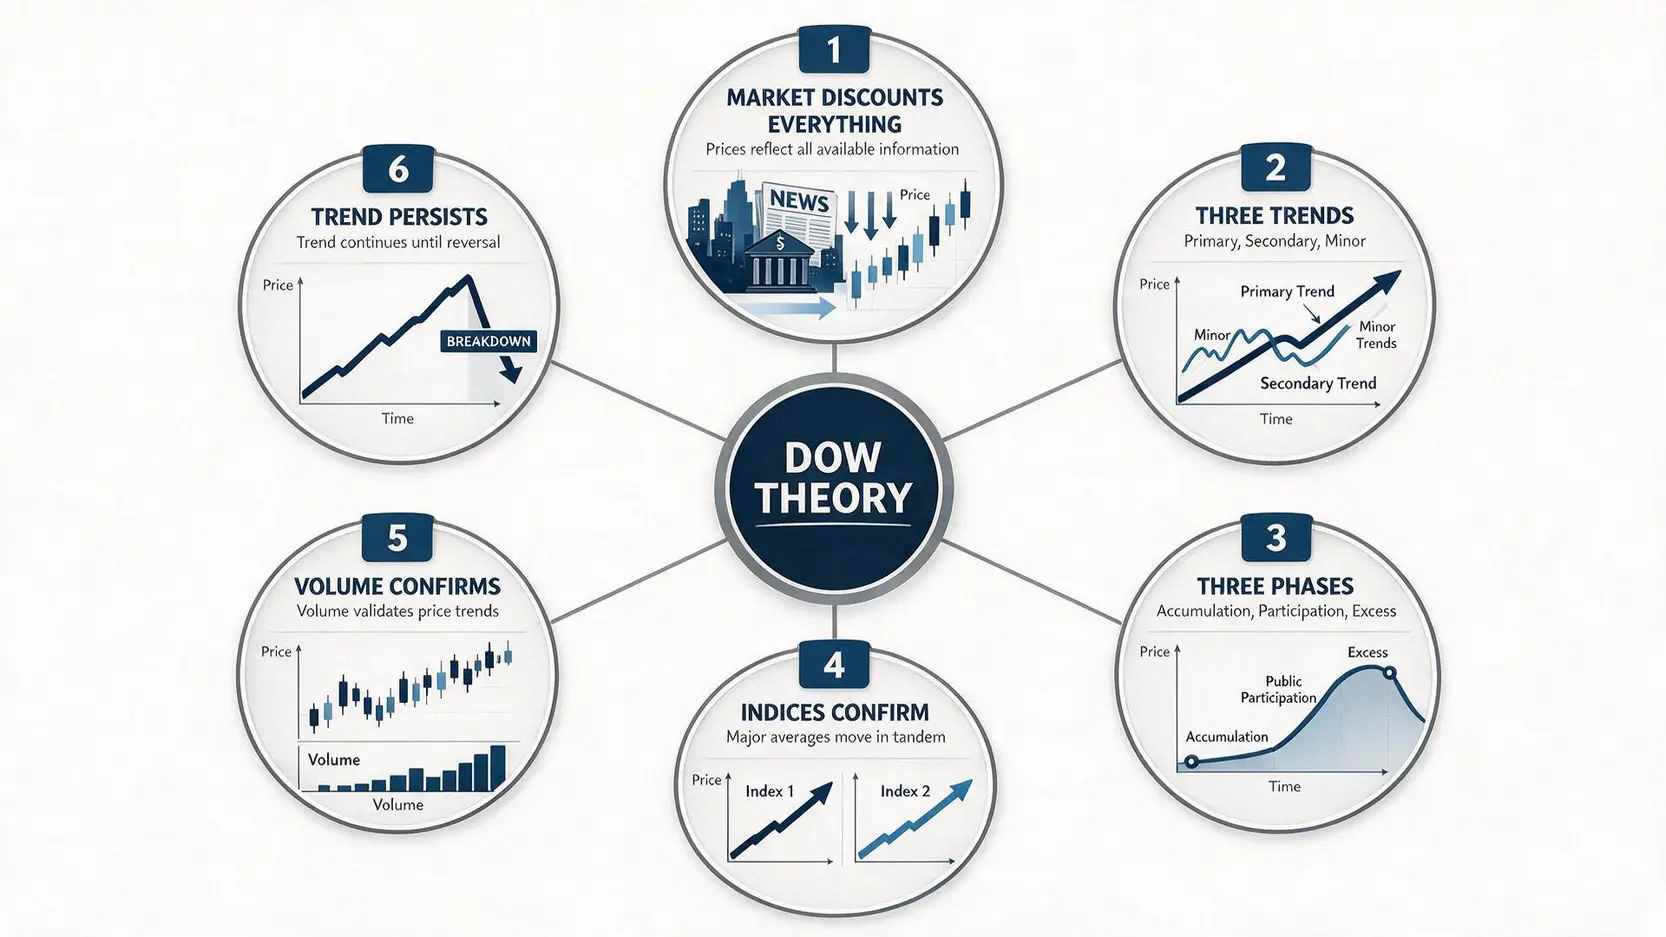
You can’t properly analyse the Dow without understanding the theory that shares its name. Developed by Charles H. Dow, the very creator of the index, Dow Theory is the bedrock of technical analysis. It’s not a trading system, but a set of principles for understanding market behaviour. I’ve seen these principles hold true through multiple market cycles.
The six core tenets of Dow Theory are:
- The Market Discounts Everything: This is the cornerstone. All information—from macroeconomic data and interest rate speculation to corporate earnings and trader sentiment—is immediately priced into the index.
- The Market Has Three Main Trends: These are the Primary (long-term, lasting a year or more), Secondary (medium-term corrections within the primary trend, lasting weeks to months), and Minor (short-term noise, lasting less than a few weeks) trends. A trader must know which trend they are operating in.
- Primary Trends Have Three Phases: In a bull market, these are the Accumulation, Public Participation, and Excess phases. In a bear market, they are the Distribution, Public Participation, and Panic phases. Recognising these phases helps in timing entries and exits.
- Indices Must Confirm Each Other: Originally, this meant the Dow Jones Industrial Average and the Dow Jones Transportation Average should move in the same direction to confirm a trend. A divergence between them is a warning sign.
- Volume Must Confirm the Trend: In an uptrend, volume should increase as prices rise and decrease as they fall. In a downtrend, volume should increase as prices fall. Volume is the fuel behind the move.
- Trends Persist Until a Clear Reversal Occurs: An existing trend is assumed to continue until there is definitive proof that it has reversed. Fighting the primary trend is one of a trader’s most costly mistakes.
Technical vs. Fundamental Analysis: Key Differences for Traders
New traders often get caught in the debate between technical and fundamental analysis. The truth is, they are two different lenses for viewing the same market, and many successful traders use a blend of both. However, for active trading, the focus often skews towards the technical side because it deals with the ‘when’ of trading, not just the ‘what’.
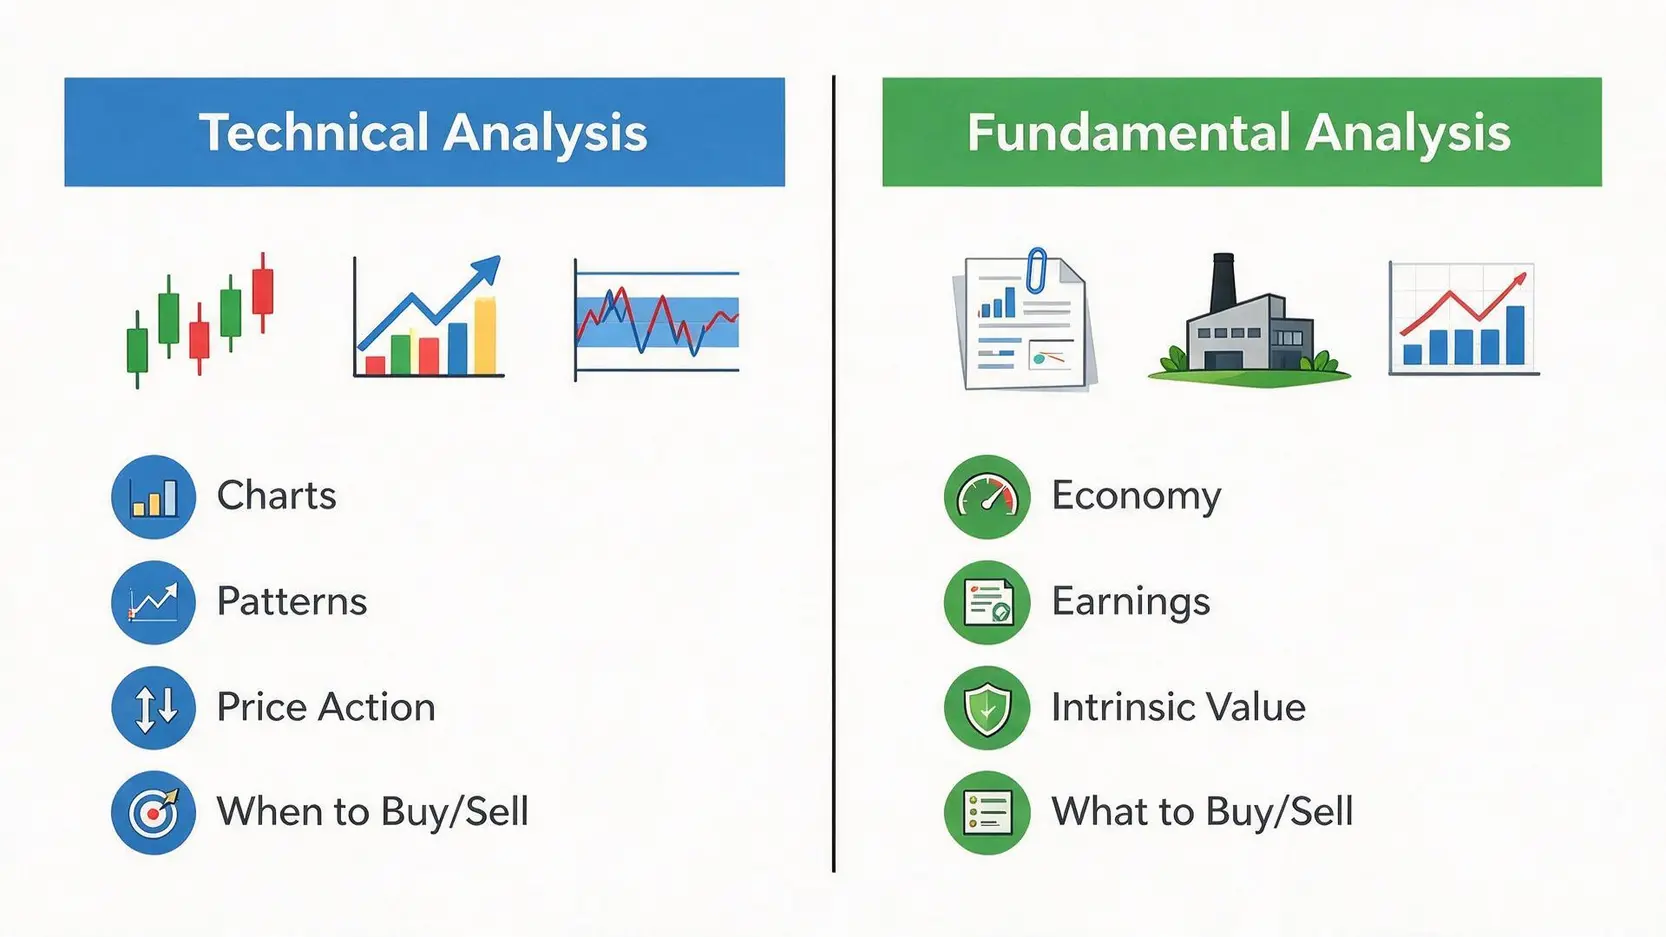
| Feature | Technical Analysis | Fundamental Analysis |
|---|---|---|
| Core Focus | Price charts, patterns, volume, and momentum. | Economic data, interest rates, corporate earnings, and geopolitical events. |
| Primary Goal | Identify trade entry and exit points based on market psychology. | Determine the intrinsic value of an asset to identify long-term opportunities. |
| Time Horizon | Short to medium-term (minutes, hours, days, weeks). | Medium to long-term (months, years). |
| Key Question | ‘When’ is a good time to buy or sell? | ‘What’ is a good asset to buy or sell? |
| Tools Used | Indicators (RSI, MACD, MA), trendlines, chart patterns. | Economic reports (Non-Farm Payrolls, GDP), central bank statements, financial statements. |
Top 3 Technical Indicators to Analyze the Dow Jones
Indicators are mathematical calculations based on the price, volume, or open interest of a security or contract. They are not crystal balls but tools designed to help you interpret the market’s current state and provide potential signals for future price movements. Let’s focus on three of the most robust and widely used technical indicators for DJIA chart analysis.
Identifying Trends: Using Moving Averages (MA) & MACD
The first step in any analysis is to identify the direction of the primary trend. Moving Averages (MAs) are the workhorse for this task. They smooth out price data to create a single flowing line, making it easier to see the underlying trend direction.
- Simple Moving Average (SMA): The simple average price over a specified period. The 50-day and 200-day SMAs are key levels watched by institutional traders. When the 50-day SMA crosses above the 200-day SMA, it’s known as a ‘Golden Cross’ (bullish). The reverse is a ‘Death Cross’ (bearish).
- Exponential Moving Average (EMA): This type gives more weight to recent prices, making it more responsive to new information. Traders often use shorter-term EMAs (e.g., 9-period, 21-period) for entry signals.
The Moving Average Convergence Divergence (MACD) indicator, developed by Gerald Appel, is a step up. It’s a trend-following momentum indicator that shows the relationship between two EMAs (typically the 12-period and 26-period). The MACD line is the difference between these two EMAs. A second line, the ‘signal line’ (a 9-period EMA of the MACD), is plotted on top. Crossovers between the MACD and its signal line can signal potential buy or sell opportunities. A crossover above the signal line is bullish, while a crossover below is bearish.
Measuring Momentum: The Relative Strength Index (RSI)
Once you’ve identified the trend, you need to gauge its strength. Is the trend running out of steam? Is it just getting started? This is where a momentum oscillator like the Relative Strength Index (RSI) comes in. Developed by J. Welles Wilder, the RSI measures the speed and change of price movements on a scale of 0 to 100.
- Overbought/Oversold Conditions: Traditionally, an RSI reading above 70 is considered ‘overbought,’ suggesting the rally might be due for a corrective pullback. A reading below 30 is considered ‘oversold,’ suggesting a decline might be due for a rebound.
- Divergence: This is one of the most powerful signals from the RSI. A ‘bullish divergence’ occurs when the price makes a new low, but the RSI makes a higher low. This indicates weakening downward momentum and a potential reversal to the upside. A ‘bearish divergence’ is the opposite.
Reading Price Action: Essential Candlestick & Chart Patterns
Indicators are derivatives of price. Price action itself is the purest indicator. Japanese candlestick charts provide more information than a simple line chart, showing the open, high, low, and close for a specific period. Individual candles and multi-candle patterns can signal reversals or continuations.
Key patterns to watch for on the DJIA chart include:
- Doji & Spinning Top: These candles have small bodies and long wicks, signalling indecision in the market. They often appear at turning points.
- Engulfing Patterns (Bullish/Bearish): A strong reversal signal where one candle’s body completely ‘engulfs’ the body of the previous candle in the opposite direction.
- Head and Shoulders: A classic reversal pattern that signals a potential top. It consists of three peaks, with the central peak (the head) being the highest.
- Double Top/Bottom: Another common reversal pattern where the price fails to break a previous high (top) or low (bottom) twice, signalling a potential trend change.
- Flags and Pennants: These are continuation patterns that form after a strong price move, representing a brief consolidation before the trend resumes.
How to Start Your Analysis: A 4-Step Practical Guide
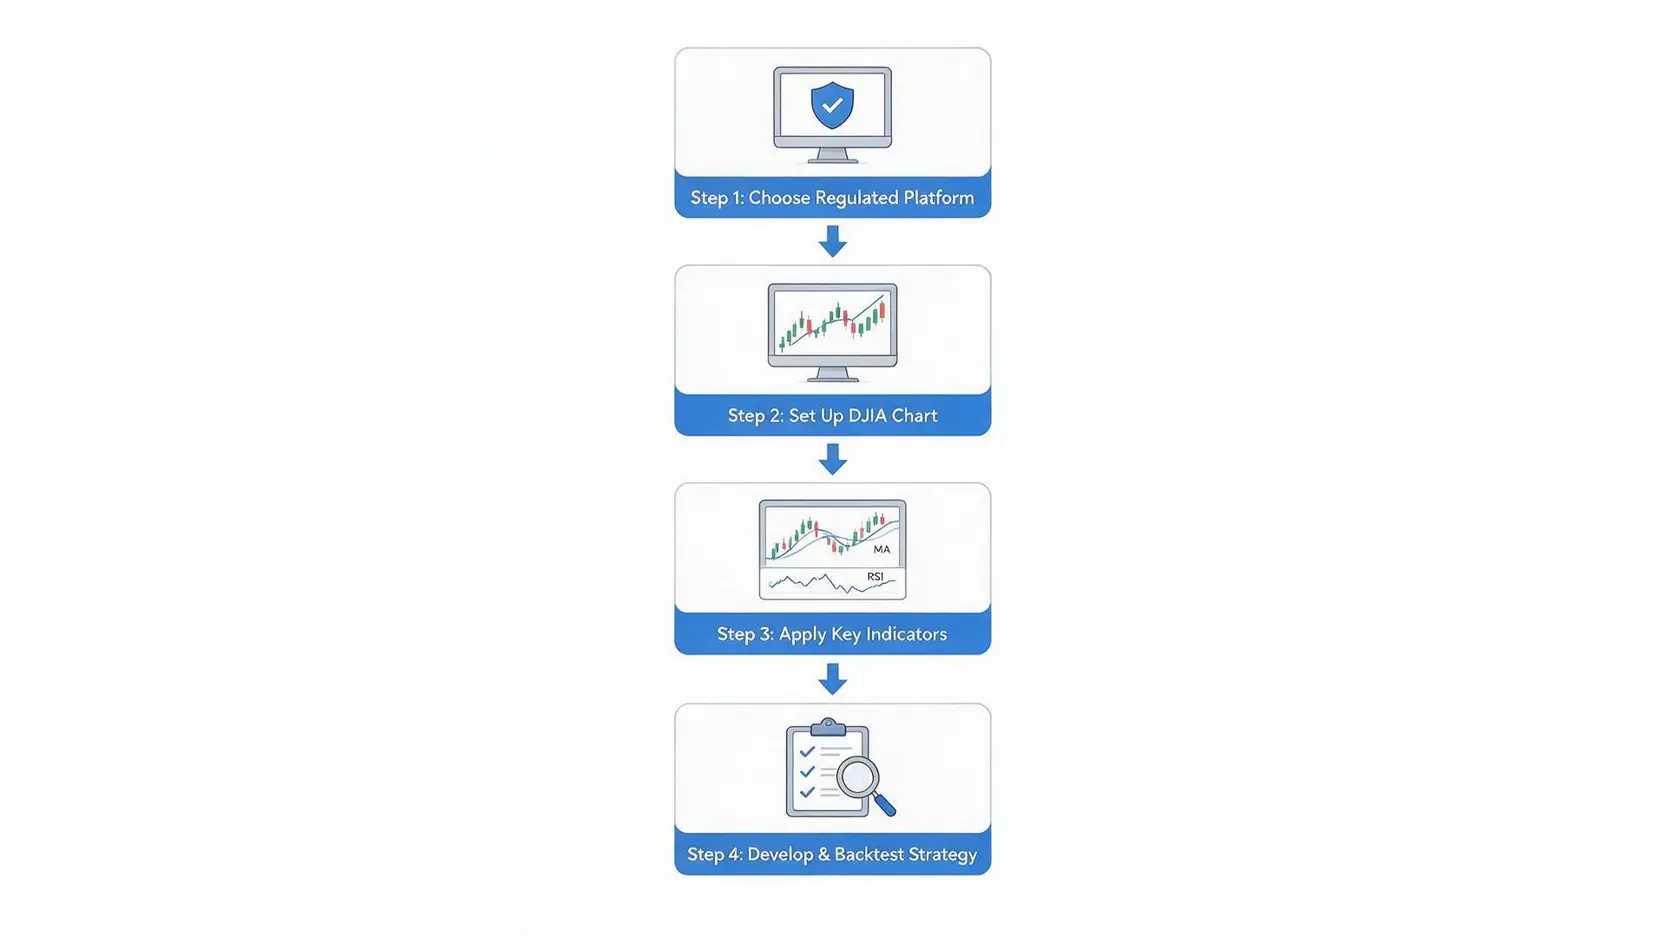
Theory is useless without application. Here is a practical, step-by-step guide to applying Dow Jones Index technical analysis from the ground up.
Step 1: Choosing a Trading Platform with Good Charting Tools
Your trading platform is your primary tool. Don’t skimp on it. For traders in the UK, the number one priority is ensuring the broker is regulated by the Financial Conduct Authority (FCA). This provides a critical layer of protection for your funds.
Beyond regulation, look for these features in their charting package:
- Clean User Interface: It should be intuitive and easy to customise.
- Wide Range of Indicators: Ensure it includes the basics like MA, MACD, and RSI, as well as drawing tools for trendlines.
- Multiple Timeframes: You must be able to switch easily from monthly charts down to hourly or even 1-minute charts.
- Reliable Data Feed: The price data must be accurate and in real-time.
- A Demo Account: A non-negotiable feature for any beginner. It allows you to practise without risking real capital.
Step 2: Setting Up Your Dow Jones Industrial Average (DJIA) Chart
Once you’ve selected a platform, the first task is to configure your workspace for clarity.
- Select the Instrument: Find the symbol for the Dow Jones Industrial Average. This might be listed as DJIA, US30, or Wall Street depending on your broker.
- Choose Candlestick Charts: This chart type offers the most visual information (open, high, low, close).
- Set Your Key Timeframes: I recommend a multi-timeframe approach. Set up three charts: a Daily chart for the primary trend, a 4-Hour chart for the secondary trend, and a 1-Hour chart for entry signals.
- Keep it Clean: Resist the urge to add too many lines or colours. The goal is to make key support and resistance levels easy to spot.
Step 3: Applying Your First Indicators to Identify Signals
Now, let’s add the indicators we discussed. Use standard settings to start; they are standard for a reason.
- On your Daily chart: Add a 50-period SMA and a 200-period SMA. This is your macro trend filter. Is price above or below the 200 SMA?
- On your 4-Hour and 1-Hour charts: Add the MACD (12, 26, 9) and the RSI (14).
A hypothetical bullish trade setup might look like this:
- Daily Chart: Price is trading above the 200 SMA and the 50 SMA. The primary trend is up.
- 4-Hour Chart: The price has pulled back to a key support level, and the RSI is approaching the 30 (oversold) level.
- 1-Hour Chart: You wait for the MACD line to cross above its signal line, and a bullish candlestick pattern (like a Bullish Engulfing) to form. This is your entry trigger.
Step 4: Developing and Backtesting a Simple Trading Strategy
An entry signal is only one part of a strategy. You must define your risk and exit plan *before* you enter a trade.
A simple strategy must include:
- Entry Rule: The specific conditions that must be met to enter a trade (e.g., the setup described above).
- Stop-Loss Rule: A pre-defined price level where you will exit the trade if it moves against you. For a long trade, this could be placed just below the recent swing low. This is the most important rule in trading.
- Take-Profit Rule: A pre-defined price level where you will exit the trade to lock in profits. This could be set at a previous resistance level or based on a risk-reward ratio (e.g., aiming for a profit that is twice the amount you are risking).
| Component | Example for a Bullish DJIA Trade | Rationale |
|---|---|---|
| Context | DJIA price is above the 200-day SMA. | Trading in alignment with the primary uptrend. |
| Entry Trigger | On the 1-hour chart, price forms a bullish engulfing pattern after a pullback, and the MACD crosses up. | Confirmation of buying momentum at a lower-risk entry point. |
| Stop-Loss Placement | Place stop-loss 10 points below the low of the bullish engulfing candle. | Defines maximum acceptable loss and invalidates the trade idea if breached. |
| Take-Profit Target | Set a target at the previous significant high, aiming for a 2:1 risk-reward ratio. | Ensures that winning trades are larger than losing trades, a key to long-term profitability. |
Frequently Asked Questions
1. Is Technical Analysis Reliable for Predicting the Dow Jones Index?
Technical analysis is not about prediction; it is about probability. No indicator or pattern can predict the future with 100% accuracy. Its reliability comes from its ability to provide a structured framework for identifying trends, momentum, and risk-managed entry/exit points. When used correctly with strict risk management, it can provide a statistical edge over the long term. But it will produce losing trades, which are a normal part of the business.
2. Which Single Technical Indicator is Best for a Beginner?
If I had to choose only one, it would be the 200-day Simple Moving Average on a daily chart. It provides an immediate, objective view of the long-term trend. It helps a beginner avoid the cardinal sin of fighting the market’s primary direction. It’s simple to understand and is a benchmark used by traders and investors globally, making it a powerful self-fulfilling prophecy at times.
3. How Much Money Do I Need to Start Trading Based on Technical Analysis?
You need £0 to start learning. Open a demo account and practise until you can execute your strategy consistently. When you move to a live account, the amount is less important than your position sizing and risk management. With brokers offering CFDs or micro-futures, you can start with a relatively small amount, perhaps £500 to £1,000. However, the key is to risk only a tiny fraction of that capital on any single trade, typically 1-2%. Never trade with money you cannot afford to lose.
Danny’s Final Thoughts
Learning Dow Jones Index technical analysis is a journey, not a destination. The charts are a reflection of human psychology, and that never changes. What does change is you. Your ability to remain disciplined when a trade goes against you, your patience to wait for a high-probability setup, and your commitment to continuous learning are what will ultimately define your success. Focus on the process, manage your risk on every single trade, and treat trading as a serious business. The market has no memory and no mercy; your survival depends on your rules.
Sources & Methodology
Danny strictly relies on primary regulatory data and authoritative official information to ensure accuracy. Data cited in this guide is sourced from:
- S&P Dow Jones Indices (for DJIA composition methodology)
- The Financial Conduct Authority (FCA) UK (for regulatory standards)
- U.S. Securities and Exchange Commission – Office of Investor Education
- Bloomberg (for market data principles)
- Securities Commission Malaysia (for investor education principles)
*Disclaimer: The content of this article represents the personal views of the author (Danny) and is for educational and reference purposes only. It does not constitute professional investment or financial advice. Trading and investing involve significant risk; proceed with caution.*
