
As a trader who has navigated the markets for over a decade, including the 2020 tech meltdown, I can tell you that the Nasdaq 100’s volatility is a double-edged sword. Many see it as pure risk, but for the prepared trader, it’s where opportunity lies. To thrive, you need the best volatility indicators for Nasdaq 100 trading. This isn’t about finding a magic signal; it’s about building a robust framework to understand and measure market sentiment. This guide will move beyond theory and provide a deep dive into the practical application of key Nasdaq 100 volatility indexes and the technical tools I rely on daily. We’ll explore not just what the Cboe NASDAQ-100 Volatility Index (VXN) is, but how to use it in your trading strategy to manage risk and identify potential turning points.
Understanding Nasdaq 100 Volatility: Key Indexes to Watch
Pro Tip: To effectively trade the Nasdaq 100, you must distinguish between its specific volatility and the broader market’s. The primary gauges for this are the Cboe NASDAQ-100 Volatility Index (VXN) and its counterpart, the VIX, which tracks the S&P 500. Focusing on VXN gives you a more precise reading of fear and expectation within the tech sector, which is the dominant force in the Nasdaq 100.
The Nasdaq 100 is a beast of its own. Dominated by technology and growth-oriented companies, its movements are often more pronounced than those of the wider market, like the S&P 500. Therefore, using a generic volatility measure can be misleading. We need specific tools for a specific job.
What is the Cboe NASDAQ-100 Volatility Index (VXN)?
The Cboe NASDAQ-100 Volatility Index, or VXN, is often called the ‘VIX for the Nasdaq’. It is a real-time index that measures the market’s expectation of 30-day volatility of the Nasdaq 100 Index (NDX). It does this by looking at the prices of NDX options. In simple terms, when the prices of these options (both puts and calls) are bid up, it signals that traders are anticipating larger price swings, and the VXN rises. Conversely, when the market is calm, option prices are lower, and the VXN falls.
The calculation is model-free and based on a weighted portfolio of out-of-the-money NDX options, designed to capture the market’s consensus on future volatility. This makes it a forward-looking indicator, which is far more valuable than historical volatility measures that only tell you what has already happened.
Introducing the Nasdaq-100 Volatility Index (VOLQ)
A newer, complementary index is the Nasdaq-100 Volatility Index (VOLQ). While the VXN provides a 30-day volatility forecast, the VOLQ focuses on the expected volatility over the next 30 days derived from at-the-money (ATM) options on the Nasdaq 100. By focusing on ATM options, VOLQ provides a more direct measure of the expected movement around the current price level.
The key distinction is its methodology. VOLQ is designed to provide a more precise, second-by-second reading of expected volatility. For day traders and those employing very short-term strategies, VOLQ can offer a more immediate sense of market nervousness. However, it’s worth noting that the VXN remains the more widely-followed and liquidly-traded measure for general market sentiment regarding the Nasdaq 100.
VXN vs. VIX: Understanding the Key Differences for Tech vs. Broader Market
Many traders make the mistake of using the VIX (Cboe Volatility Index) as their sole guide, even when trading the Nasdaq 100. This is a critical error. The VIX measures the expected volatility of the S&P 500, a broad index representing the entire U.S. economy. The VXN is laser-focused on the tech- and growth-heavy Nasdaq 100. Their paths can and do diverge.
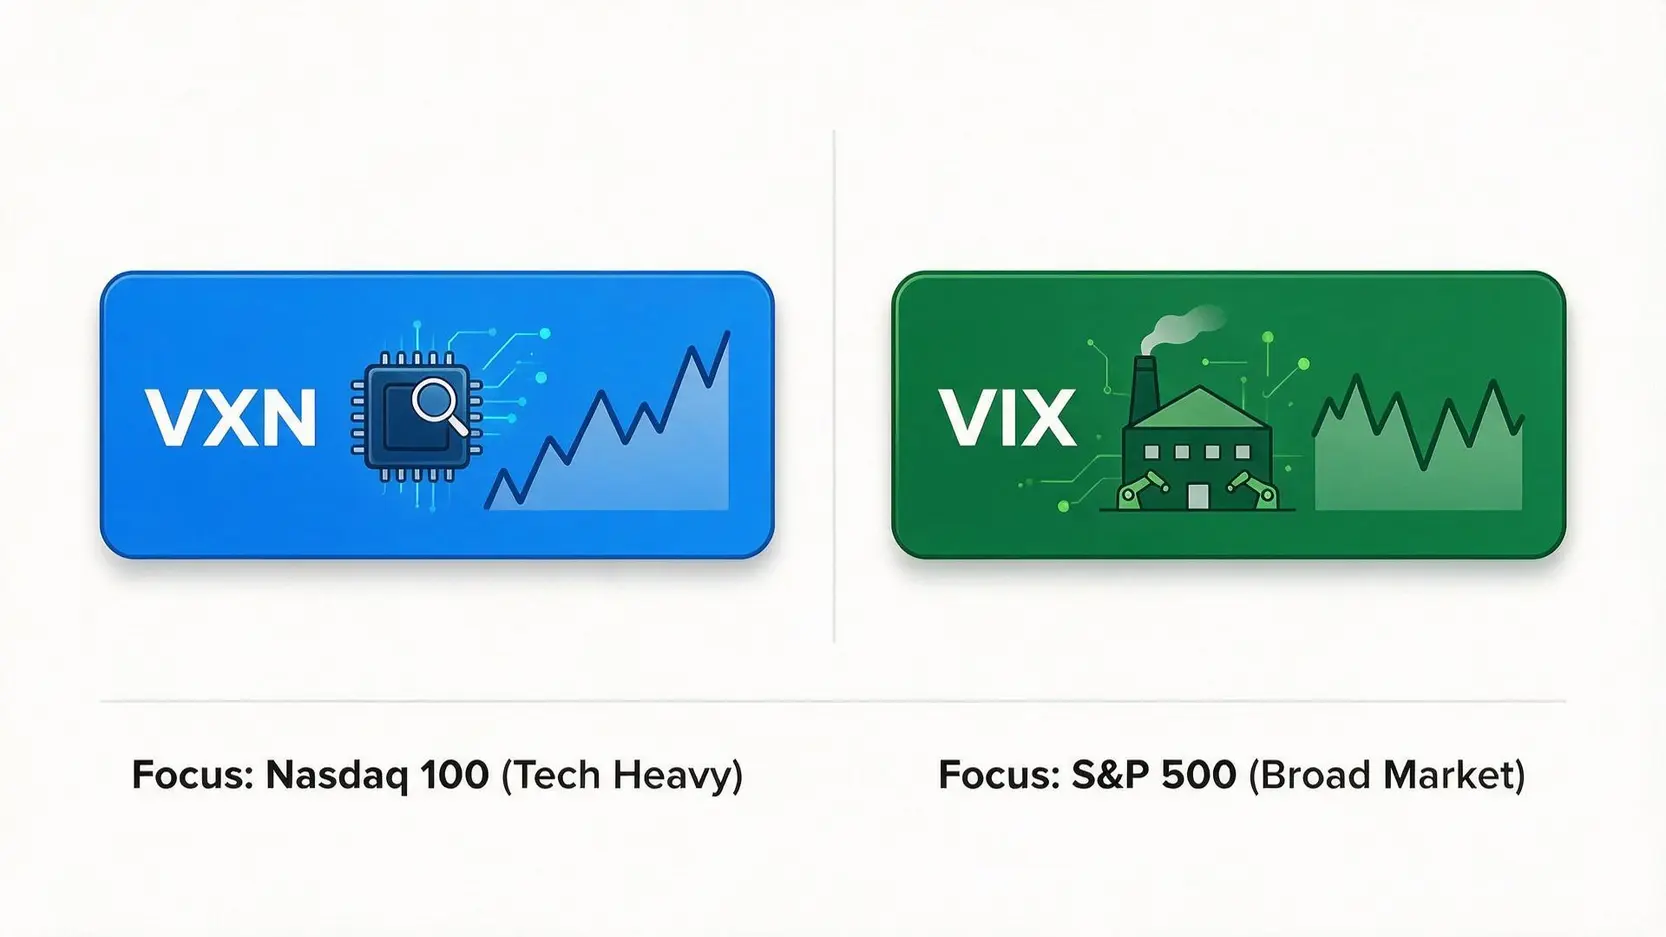
For example, during a period where a regulatory threat looms over the technology sector, the VXN might spike significantly while the VIX remains relatively subdued, as industrial or financial stocks in the S&P 500 are unaffected. As a Nasdaq trader, the VXN is your primary sentiment gauge.
| Feature | Cboe NASDAQ-100 Volatility Index (VXN) | Cboe Volatility Index (VIX) |
|---|---|---|
| Underlying Index | Nasdaq 100 (NDX) | S&P 500 (SPX) |
| Market Focus | Technology, growth, and large-cap non-financials | Broad market; 500 of the largest U.S. companies across all sectors |
| What it Measures | Expected 30-day volatility of the Nasdaq 100 | Expected 30-day volatility of the S&P 500 |
| Best For | Traders focusing on tech stocks, QQQ ETF, and Nasdaq futures | Gauging overall market fear and macroeconomic risk |
| Typical Behaviour | Generally higher and more volatile than the VIX due to the nature of tech stocks | Considered the primary ‘fear index’ for the entire U.S. stock market |
The Top Technical Indicators for Measuring Nasdaq 100 Volatility
Pro Tip: While the VXN tells you about *expected* volatility, chart-based indicators tell you about *actual* or *realised* volatility. The most effective approach combines both. My go-to combination is using Bollinger Bands to identify periods of volatility compression (the ‘Squeeze’) and the Average True Range (ATR) to set dynamic, volatility-adjusted stop-losses.
Moving from index-level analysis to the chart itself, we need indicators that can visually represent volatility. These tools help us define risk, identify potential breakouts, and avoid getting shaken out of good positions by meaningless noise.
Using Bollinger Bands to Identify Trading Ranges and Breakouts
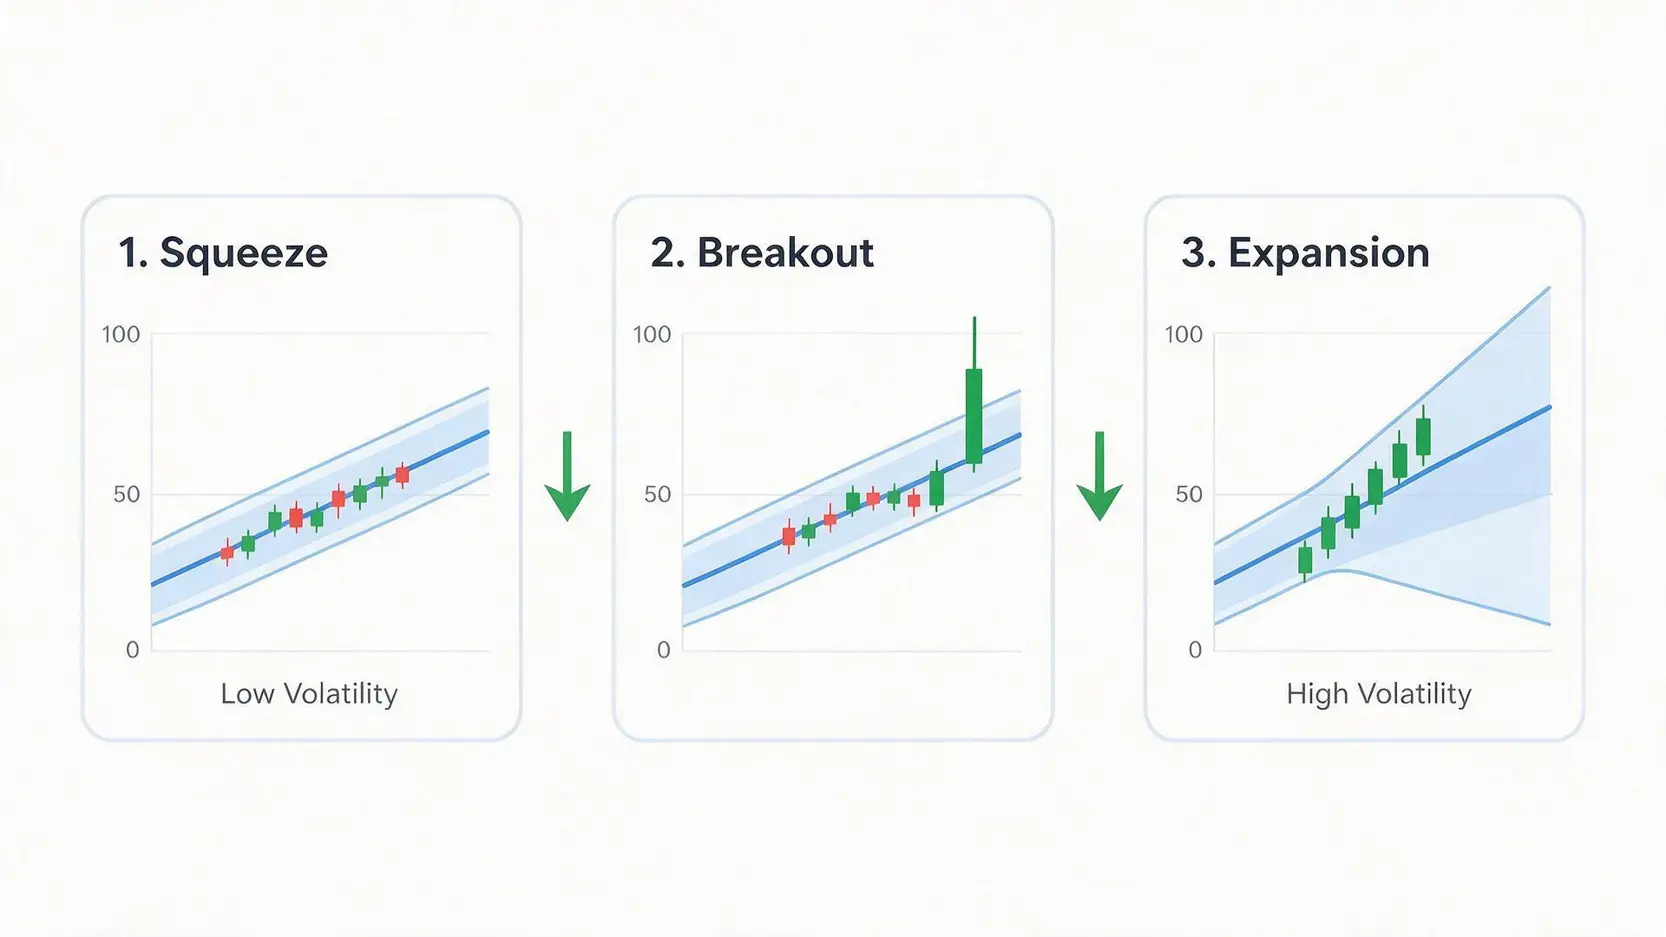
Created by John Bollinger, Bollinger Bands consist of a middle band (typically a 20-period simple moving average) and two outer bands set at two standard deviations above and below the middle band. The common mistake is to see the outer bands as simple overbought/oversold signals. Their true power lies in what the *width* of the bands tells you.
- The Squeeze: When the bands constrict and move closer together, it signifies a period of low volatility. This is the market coiling like a spring. It’s a warning sign that a significant price move, or a volatility expansion, could be imminent.
- The Breakout: Following a squeeze, a price break above the upper band or below the lower band, often accompanied by the bands rapidly widening, can signal the start of a powerful new trend.
Applying the Average True Range (ATR) for Risk Management
Developed by the legendary J. Welles Wilder Jr., the Average True Range (ATR) is, in my opinion, the single most important indicator for risk management. Unlike other indicators, ATR provides no directional signal whatsoever. Its only job is to measure volatility, expressed as an absolute monetary value for a given period.
It tells you, on average, how much the asset has moved from high to low during each of the last ‘N’ periods (typically 14). So, if the daily ATR on the QQQ ETF is $3.50, it means the average daily range has been $3.50 over the past 14 days.
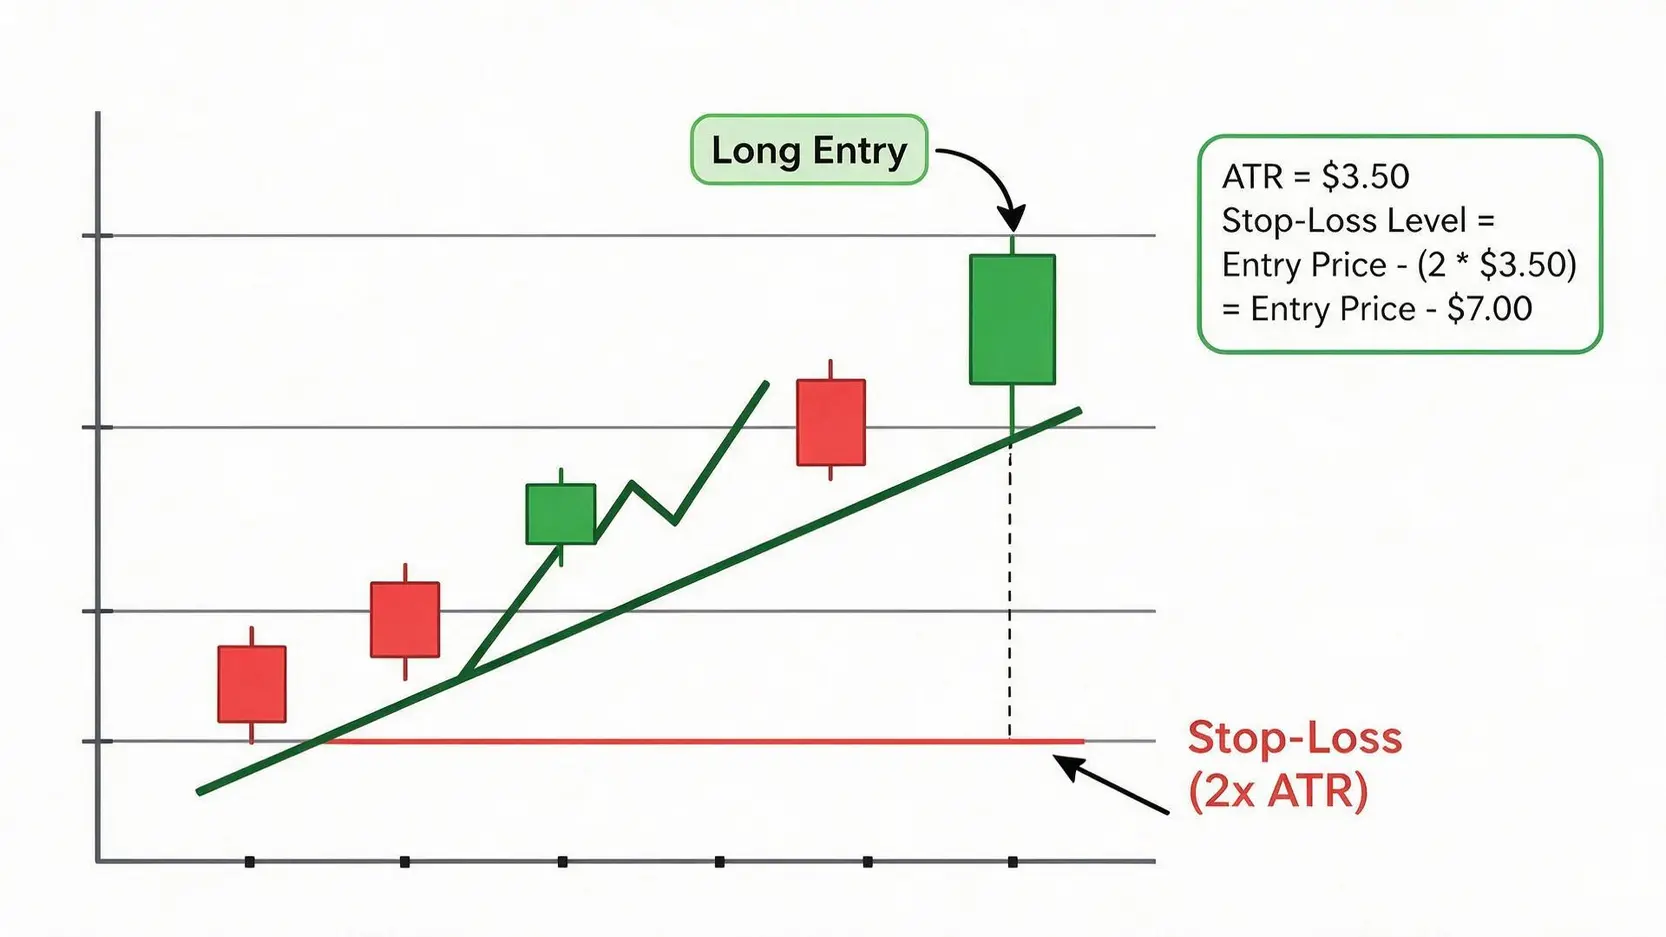
How do I use it? For setting stop-losses. A static 1% stop-loss is meaningless. A 1% move on a calm day is huge, while a 1% move during a high-volatility period is just noise. Instead, I place my initial stop-loss at a multiple of the ATR—often 1.5x or 2x the current ATR value below my entry for a long position. This ensures my stop is outside the ‘normal’ market noise, giving my trade room to breathe while still providing a defined exit point if I’m wrong.
Leveraging Keltner Channels to Gauge Trend Strength
Keltner Channels are similar to Bollinger Bands in that they plot bands above and below a moving average. However, instead of using standard deviation, they use the Average True Range (ATR) to set the band width. This makes them a pure measure of volatility.
I find them most useful as a trend-following filter. A strong uptrend in the Nasdaq 100 will see prices consistently ‘walking up’ the upper Keltner Channel without falling back to the middle line. When the price crosses back inside the channel, it can be an early warning that the trend’s momentum is waning. Comparing Keltner Channels to Bollinger Bands can also be insightful. When Bollinger Bands are inside the Keltner Channels, it confirms a very low volatility state (a deep squeeze), often preceding a very powerful move.
| Indicator | Primary Use Case | Strength | Limitation |
|---|---|---|---|
| Bollinger Bands | Identifying volatility compression (Squeeze) and expansion (Breakouts) | Excellent for spotting potential shifts from low to high volatility | Not a directional indicator; can give false breakout signals in choppy markets |
| Average True Range (ATR) | Risk management; setting dynamic stop-loss levels and position sizing | Provides a clear, objective measure of current price volatility | Offers zero information about price direction or trend strength |
| Keltner Channels | Confirming trend strength and identifying potential trend exhaustion | Uses ATR for its calculation, making it smooth and effective in trending markets | Less effective in range-bound or sideways markets compared to Bollinger Bands |
Practical Trading Strategies Using Volatility Indicators
Pro Tip: Strategies should not be rigid formulas but flexible frameworks. A robust strategy uses volatility data as a filter. For example, a rule could be: “Do not initiate new long positions if the VXN has closed above 30 for two consecutive days” or “Only look for breakout trades when the Bollinger Band Width is at a 20-day low.”
How to Hedge Your Nasdaq 100 Positions Using Volatility Data
Hedging is an essential survival skill. If you hold a portfolio of tech stocks that are highly correlated to the Nasdaq 100, you are exposed to significant systemic risk. When you see the VXN begin to climb, especially above the 25-30 level, it’s a signal that institutions are buying protection (options), and you should consider it too.
A straightforward hedge for a retail trader is to buy put options on the QQQ ETF. A put option gives you the right, but not the obligation, to sell the QQQ at a predetermined price. If the Nasdaq 100 falls, the value of your put options will rise, offsetting some of the losses in your stock portfolio. How many puts to buy and at what strike price is a more complex topic, but the *signal* to start looking at this strategy comes directly from rising volatility indicators like the VXN.
Strategies for Trading Volatility Breakouts on the Nasdaq 100
This is a strategy I have relied on for years. It combines the tools we’ve discussed into a coherent plan of attack.
- Condition: Identify a Volatility Squeeze. On a 4-hour or Daily chart of the Nasdaq 100 (or its ETF/futures), look for the Bollinger Bands to narrow significantly. This should be confirmed by the Bollinger Band Width indicator reaching a multi-week low. The ATR should also be relatively flat or declining.
- Trigger: The Breakout. Wait for a strong candle to close decisively outside the Bollinger Bands. For a long trade, it must close above the upper band; for a short, below the lower band. This candle should be larger than average, and the breakout should occur with a noticeable increase in volume.
- Confirmation: Volatility Expansion. The ATR indicator should tick up on the breakout, confirming that volatility is expanding. The Bollinger Bands themselves should begin to widen noticeably.
- Entry & Risk Management: Enter on the open of the next candle after the breakout close. Place your stop-loss at 1.5x or 2x the ATR below the low of the breakout candle (for a long) or above the high (for a short). Your first profit target could be when the price touches the opposite Bollinger Band, or you can use a trailing stop (like a multiple of ATR) to ride the trend.
Frequently Asked Questions
1. What is considered high volatility for the Nasdaq 100?
From my perspective, ‘high’ is relative, but there are some general guideposts. For the VXN index, a sustained reading above 30 indicates significant market fear and an expectation of large price swings (potentially +/- 2% per day). A spike above 40, as we saw during the 2020 crash, signals extreme panic. On a chart, you can spot high volatility when the daily ATR is trending sharply upwards and the Bollinger Bands are wide and expanding.
2. Can I trade the VXN or VOLQ index directly?
For the vast majority of retail traders, the answer is no. These are indexes, like the Dow Jones Industrial Average. You cannot buy or sell them directly. There are futures and options contracts based on them (and on the VIX), but these are complex financial instruments primarily used by institutions and professional traders for hedging and speculation. They are not suitable for beginners. Retail traders are better off using the indexes as indicators and trading the underlying asset (e.g., the QQQ ETF).
3. Which indicator is best for a beginner trading the Nasdaq 100?
If I had to choose only one, it would be the Average True Range (ATR). Before a beginner even thinks about profit targets or entries, they must master risk management. The ATR is a pure risk management tool. Learning to set your stop-loss based on the market’s current volatility (using ATR) instead of a random percentage will save you from countless painful losses and is the first step toward building the discipline required to survive in this game.
4. How often should I check the VXN?
If you are an active trader of the Nasdaq 100, you should have the VXN on your screen just like you have the index itself. I check it at the start of every trading day to get a feel for the market’s mood. If I see it climbing during the day, especially if it’s breaking a recent high, I become more cautious with my open positions. It’s a real-time sentiment barometer that should be part of your core trading dashboard.
Danny’s Final Thoughts
Sources & Methodology
Danny strictly relies on primary regulatory data and authoritative official information to ensure accuracy. Data cited in this guide is sourced from:
*Disclaimer: The content of this article represents the personal views of the author (Danny) and is for educational and reference purposes only. It does not constitute professional investment or financial advice. Trading and investing involve significant risk; proceed with caution.*
