
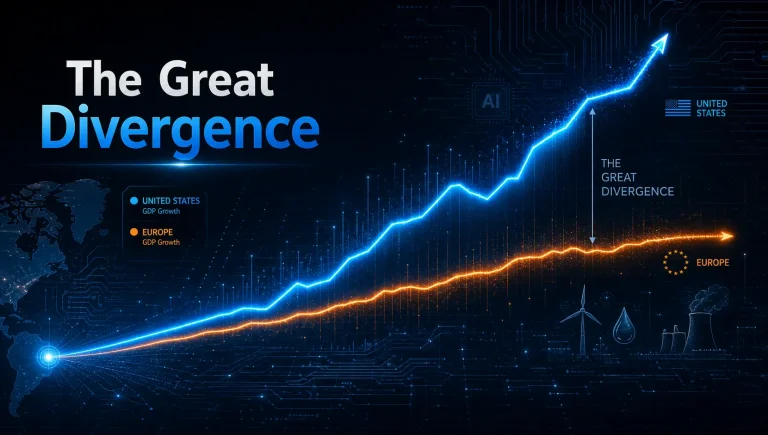
As a market analyst, I’m constantly asked about the dominant macroeconomic narratives shaping asset prices. For the past few years, the persistent and widening divergence between US and European economic growth rates has been a central theme.
This isn’t just academic chatter; it has profound implications for forex pairs like EUR/USD, transatlantic equity flows, and corporate strategy.
This article will provide a data-backed examination of this US vs European economic performance gap, dissecting the key factors driving the economic divergence between the US and EU from a professional trader’s perspective, moving beyond simplistic headlines to offer actionable insights for 2026 and beyond.
The Widening Gap: A Data-Driven Overview
Pro Tip: The data confirms a clear and widening gap. Since 2020, the U.S. has consistently outpaced the Eurozone in real GDP growth, productivity, and investment. While both economies faced the same global shocks—pandemic, inflation, supply chain disruption—their recovery trajectories have been starkly different. The U.S. has demonstrated greater resilience and dynamism.
Comparing Recent GDP and Productivity Growth Rates
The numbers speak for themselves. According to the latest IMF World Economic Outlook, the US economy is projected to grow significantly faster than the Euro area.
For instance, the April 2026 projections often show the US with growth rates double or even triple that of major European economies like Germany. This isn’t a one-off event.
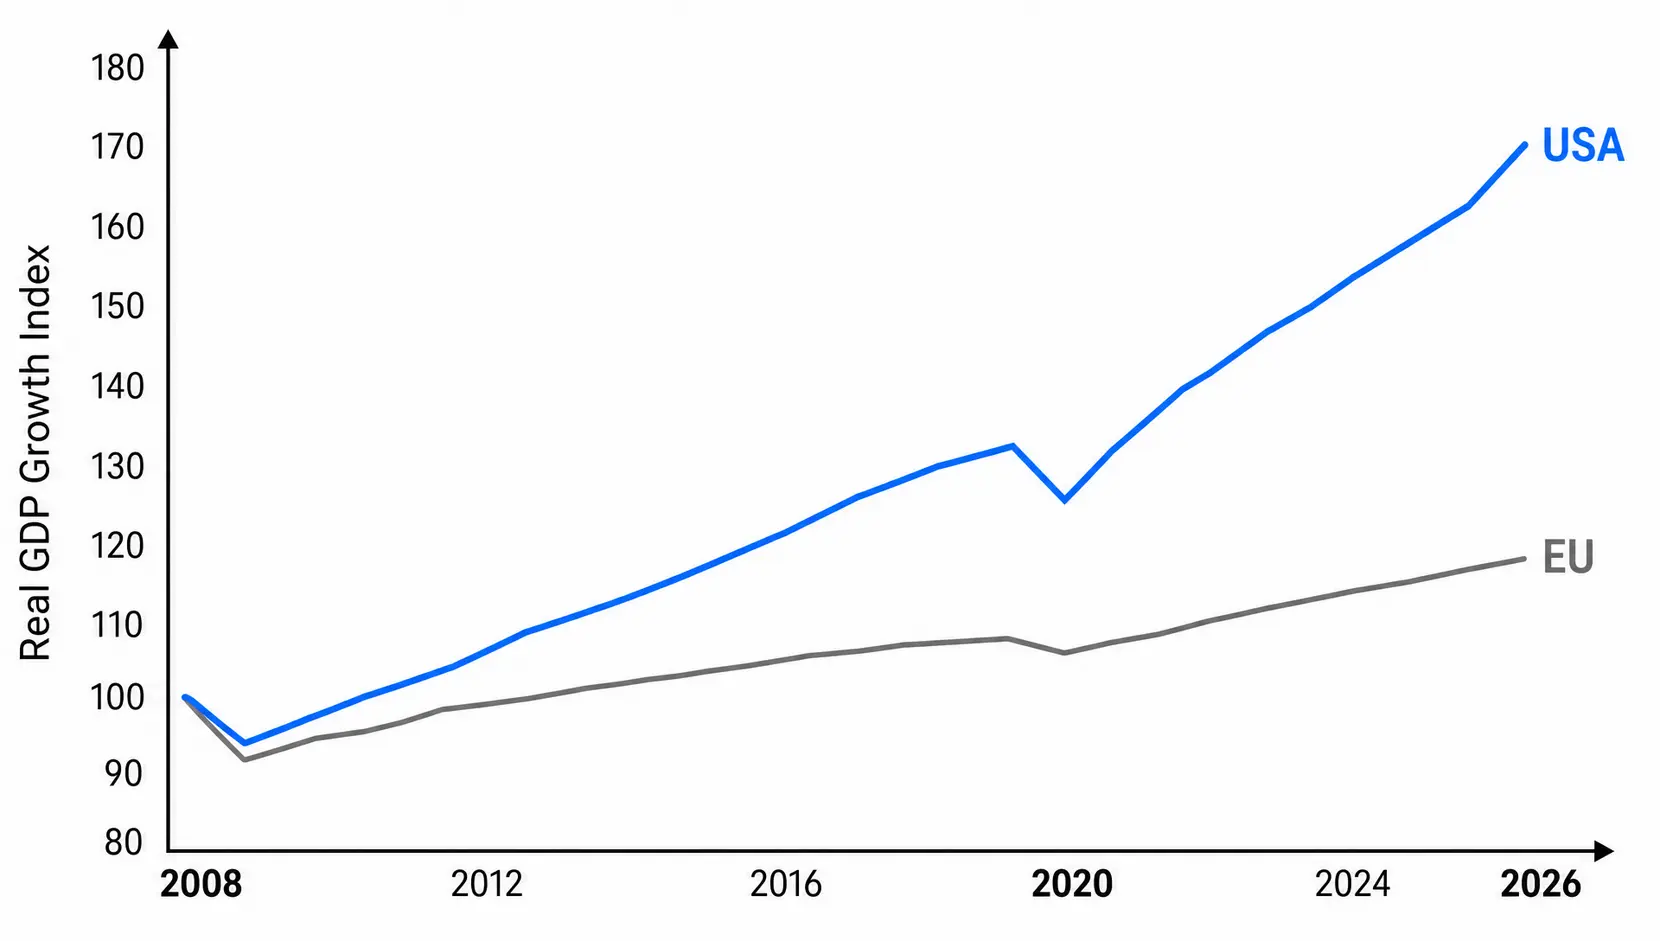
A look at the data from the past five years reveals a consistent pattern of American outperformance. This divergence is even more pronounced when looking at GDP per capita, where the U.S. has pulled ahead substantially.
Productivity growth, a key determinant of long-term economic health, also shows the U.S. leading, particularly in sectors driven by technological innovation.
Visualizing the Long-Term Trend: Has the Gap Always Existed?
While a gap has existed for decades, it has accelerated dramatically since the 2008 Global Financial Crisis and again after the 2020 pandemic.
Historically, Europe and the US would often move in closer tandem. However, the US recovery from both crises was faster and more robust, fuelled by aggressive monetary and fiscal stimulus and, crucially, a dynamic private sector that could rapidly adapt and innovate.
The EU, by contrast, has often been hampered by slower, more consensus-driven policy responses and structural rigidities.
Key Factors Driving the Economic Divergence
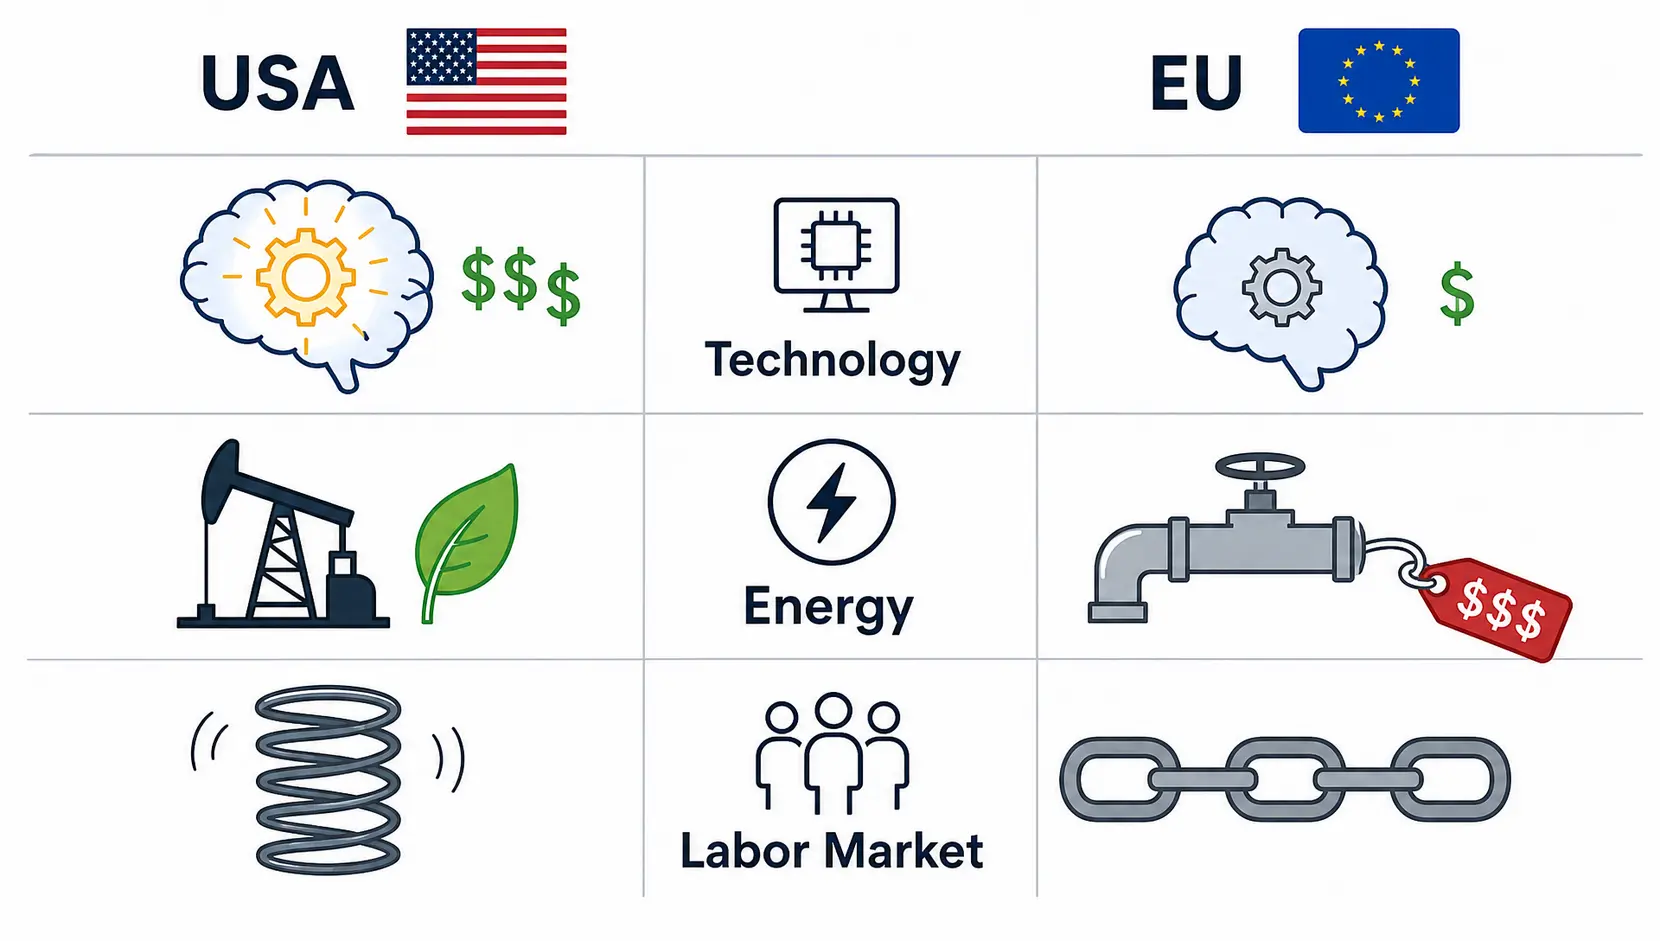
Logical Summary: The divergence is not from a single cause but a confluence of factors. The three most critical pillars are: a yawning gap in technological innovation and its commercialisation, a structural disparity in energy costs and independence, and fundamental differences in the flexibility of labour markets and demographic outlooks.
The Role of Technological Innovation and Venture Capital
This is perhaps the most significant factor. The U.S. is home to a vibrant ecosystem of technological innovation, underpinned by the world’s deepest venture capital market.
Tech giants like Apple, Microsoft, and Nvidia are not just American companies; they are global platforms that drive productivity gains across the entire economy. Europe, despite having pockets of excellence, has failed to produce tech behemoths on a similar scale.
The flow of venture capital is a clear indicator: for every Euro invested in a European tech startup, multiple dollars are invested in its American counterpart. This capital disparity starves European innovation of the fuel it needs to scale globally.
Impact of Energy Costs and Geopolitical Shifts
The US shale revolution has made it a net energy exporter, providing its industries with a significant competitive advantage in the form of cheaper, more stable energy prices.
In contrast, Europe’s heavy reliance on imported energy was starkly exposed following the geopolitical shifts of the early 2020s. Persistently higher energy costs for European manufacturers act as a direct tax on their competitiveness, compressing margins and deterring investment.
While Europe is accelerating its green transition, this process is capital-intensive and will take years to fully offset the current cost disadvantage.
Differences in Labour Market Flexibility and Demographics
American labour markets are famously flexible, allowing companies to hire and scale quickly to meet demand. While this has social trade-offs, from a purely economic perspective, it fosters dynamism.
European labour markets, with stronger worker protections and regulations, are more rigid. This can lead to slower job creation and make it harder for companies to adapt to changing market conditions.
Compounding this is a demographic headwind: Europe’s population is aging more rapidly than America’s, putting a long-term strain on its workforce and social welfare systems.
| Factor | United States | European Union |
|---|---|---|
| Projected GDP Growth (2026) | ~2.1% (IMF Estimate) | ~1.2% (IMF Estimate) |
| Technology Sector | Dominant global players, deep VC market | Fragmented, lacks scale, lower VC funding |
| Energy Costs | Advantaged (Net Exporter, lower prices) | Disadvantaged (Importer, higher prices) |
| Labour Market | Highly Flexible | More Rigid, high regulation |
Are We Measuring It Right? Critiques and Considerations
Pro Tip: While GDP figures paint a stark picture, they don’t tell the whole story. As analysts, we must look beyond the headlines. When adjusted for currency fluctuations using Purchasing Power Parity (PPP), the gap narrows. Furthermore, GDP is a measure of economic output, not necessarily of well-being. A nuanced view is essential.
The Impact of Currency Fluctuations on Growth Comparisons
A significant portion of the recent divergence, when measured in nominal US dollars, can be attributed to the strength of the dollar. When the EUR/USD exchange rate falls, the dollar value of the EU’s GDP also falls, even if its economy is growing in euro terms.
The Bank for International Settlements (BIS) frequently publishes research on how exchange rate volatility impacts economic data.
Comparing economies using a PPP-adjusted exchange rate, which accounts for differences in the cost of living, provides a more balanced picture, though it still shows a US advantage.
Beyond GDP: Alternative Metrics for Economic Well-being
Is a country with a higher GDP necessarily a ‘better’ place? Metrics like the Human Development Index (HDI), life expectancy, income inequality, and work-life balance are crucial.
On many of these ‘quality of life’ indicators, European nations consistently outperform the United States. They offer more robust social safety nets, universal healthcare, and greater leisure time.
This doesn’t negate the economic growth divergence, but it places it in a broader, more human context. Forgetting this is a common mistake among purely quantitative analysts.
Frequently Asked Questions
1. How much faster is the U.S. economy growing than the European Union’s?
Based on 2026 forecasts from institutions like the IMF, the U.S. economy is projected to grow at a rate roughly 0.8 to 1.2 percentage points faster than the Eurozone.
For example, if the U.S. is forecast to grow at 2.1%, the Eurozone might be forecast at around 1.0%. This gap can fluctuate based on quarterly data but the trend of U.S. outperformance is well-established.
2. What are the main arguments for why Europe is falling behind the USA economically?
The primary arguments centre on three structural areas. First, a significant technology and innovation gap, evidenced by the lack of large-scale European tech companies and a much smaller venture capital market.
Second, a structural energy cost disadvantage due to a higher reliance on imports. Third, less flexible labour markets and more challenging demographic trends (a more rapidly aging population) compared to the U.S.
3. Are GDP figures a reliable way to compare the US and EU economies?
GDP is a useful but incomplete measure. While it effectively shows the scale of economic output and is a key driver for market sentiment, it can be distorted by currency fluctuations.
Furthermore, it doesn’t capture crucial aspects of well-being such as income inequality, healthcare access, or environmental quality. Many economists argue for using a dashboard of indicators, including GDP, PPP-adjusted figures, and social metrics, for a more holistic comparison.
Andrew Wong’s Final Thoughts
The great divergence between the US and European economies is not a fleeting headline; it is one of the most critical macroeconomic trends of our time, born from deep structural realities.
For traders and investors, understanding the drivers—technology, energy, and policy—is non-negotiable. While the US currently has the upper hand in dynamism and growth, Europe’s strengths in social stability and quality of life should not be dismissed.
As I always maintain, market movements are a combination of macroeconomic gravity and technical psychology. The gravity of these structural factors is clear, but the market’s psychological reaction to them will continue to provide opportunities and risks for the foreseeable future.
Sources & Methodology
Andrew Wong strictly relies on primary regulatory data and authoritative official information to ensure accuracy. Data cited in this guide is sourced from:
*Disclaimer: The content of this article represents the personal views of the author (Andrew Wong) and is for educational and reference purposes only. It does not constitute professional investment or financial advice. Trading and investing involve significant risk; proceed with caution.*
