

As a market analyst, I’ve observed that few financial instruments are as intricately linked to the real economy as Mortgage-Backed Securities (MBS).
The US housing market data impact on Mortgage-Backed Securities is not merely a correlation; it’s a fundamental driver of value, risk, and return.
For investors in 2026, understanding this symbiotic relationship is paramount, especially as we navigate a landscape shaped by recent central bank tightening cycles.
The nuances of the relationship between interest rates, the housing market, and MBS are critical, as is monitoring the key housing market indicators that affect MBS valuation and performance.
This guide will dissect these connections from a macro-analytical perspective.
The Fundamentals: What Are MBS and Key Housing Market Indicators?
To fully grasp the mechanics of this market, we must first establish a clear understanding of the instrument in question and the data that governs its behaviour. Without this foundational knowledge, any attempt at analysis is akin to navigating without a compass.
Defining Mortgage-Backed Securities (MBS): A Primer for Investors
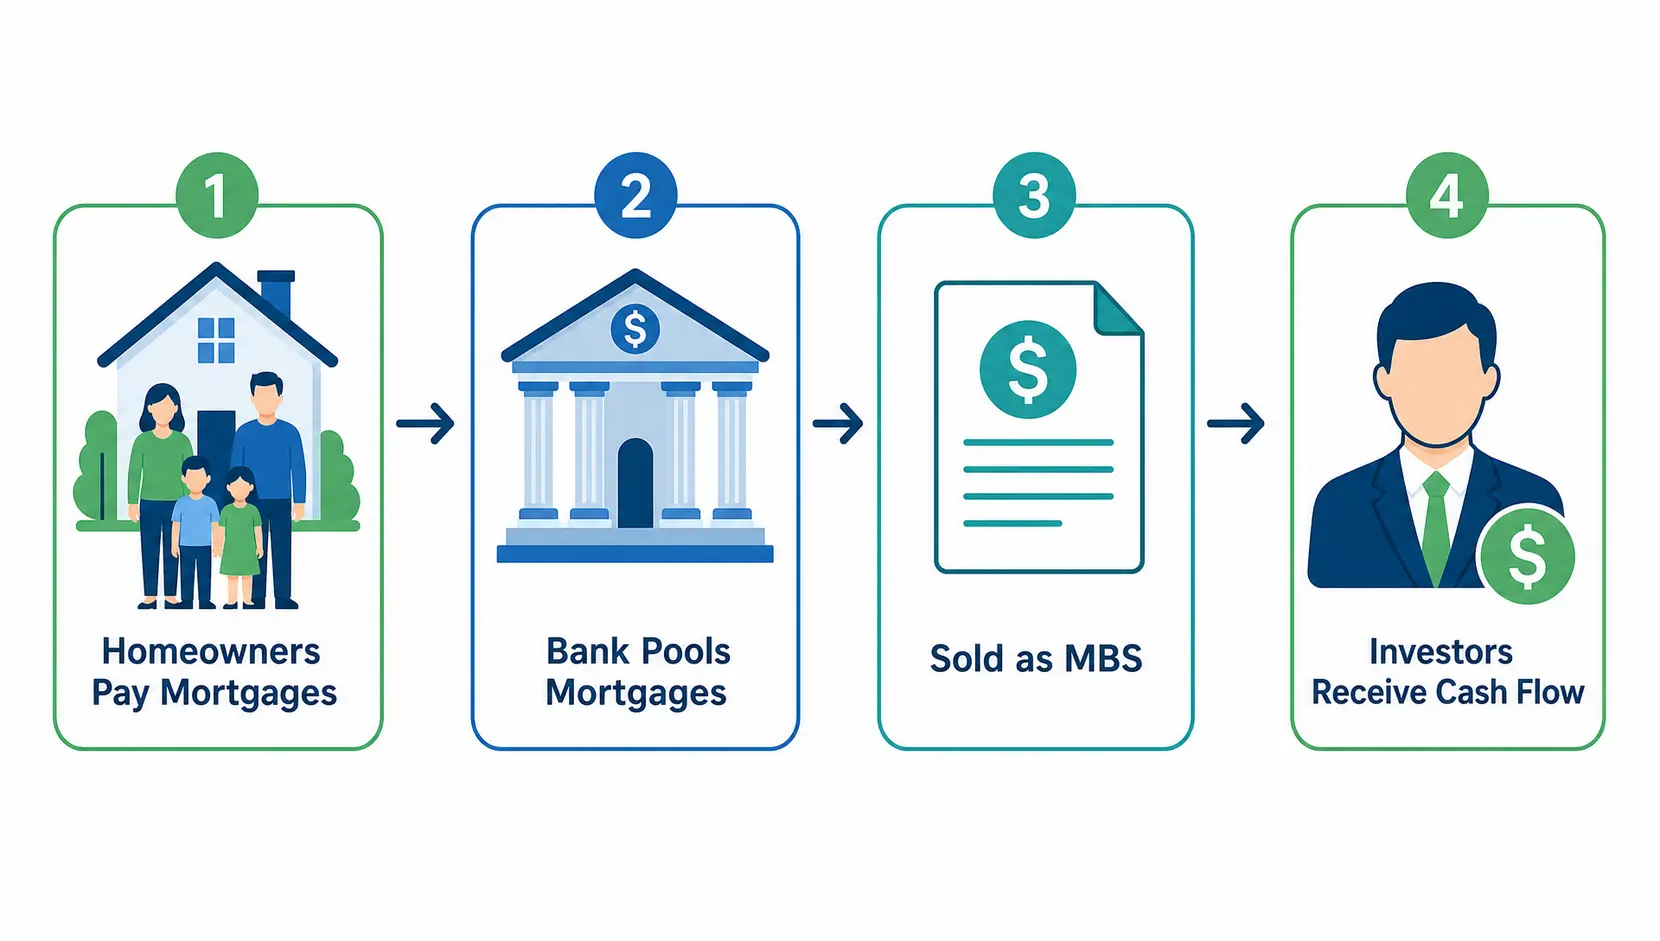
A Mortgage-Backed Security is an investment instrument that represents an ownership interest in a bundle of home loans. When a financial institution issues hundreds or thousands of mortgages, it can pool them together and sell them as a security in the secondary market.
Investors who purchase the MBS are entitled to a share of the monthly principal and interest payments made by the homeowners whose loans are in the pool.
This process, known as securitisation, serves a crucial function: it provides liquidity to the mortgage market. By selling their mortgages to investors, original lenders (like banks) receive fresh capital, which they can then use to issue new loans.
This keeps the housing finance system flowing. These securities are typically categorised based on the entity that guarantees them, a crucial distinction we will explore later.
Top 4 US Housing Market Data Points to Monitor
To build a robust analytical framework, one must focus on the data that provides the clearest signal on the health of the underlying mortgages.
I prioritise the following four indicators:
- House Price Indices (HPI): This is arguably the most critical metric. Rising home prices build equity for homeowners, significantly reducing the likelihood of default. A homeowner with substantial equity is less likely to ‘walk away’ from their obligation, even if they face financial hardship. Conversely, falling prices can create ‘negative equity’, where the loan balance exceeds the property value, elevating default risk. Authoritative sources for this data include the Federal Housing Finance Agency (FHFA) House Price Index.
- Existing & New Home Sales: Sales volume is a direct measure of market activity and liquidity. High sales volume, coupled with rising prices, indicates a robust market. A sudden drop in sales can be a leading indicator of a market downturn, signalling decreasing affordability or waning consumer confidence. This data is published by sources like the National Association of Realtors (NAR) and the U.S. Census Bureau.
- Housing Inventory & Months’ Supply: This metric tracks the number of homes available for sale. A low inventory level (or ‘months’ supply’) typically leads to spread compression and pushes prices higher, which is generally positive for the credit quality of existing MBS. An oversupply, on the other hand, puts downward pressure on prices, increasing systemic risk for MBS holders.
- Mortgage Delinquency and Foreclosure Rates: This is the most direct measure of credit performance within the mortgage pools. An increase in delinquency rates is a red flag, indicating that a growing number of borrowers are unable to make their payments. This directly translates to interruptions in the cash flows passed through to MBS investors and can precede a wave of defaults. Data from entities like the Mortgage Bankers Association (MBA) is invaluable here.
The Core Relationship: How Key Housing Market Indicators Affect MBS
The machinery of the housing market directly gears the performance of MBS. The connection is not passive; it is an active, dynamic relationship where changes in one domain trigger immediate and predictable responses in the other.
Understanding this transmission mechanism is the key to anticipating MBS price movements.
Interest Rates as the Bridge: Impact on Housing Affordability and MBS Valuation
Central bank monetary policy acts as the primary bridge connecting the macro-economy to the housing market and, by extension, to MBS. When the Federal Reserve alters the federal funds rate, it creates a ripple effect.
While the Fed doesn’t set mortgage rates directly, its policy actions heavily influence the broader bond market, including the yields on Treasury bonds, which serve as a benchmark for mortgage lenders.
A lower interest rate environment generally stimulates the housing market by improving affordability. Cheaper mortgages encourage more buyers, which tends to increase home sales and push prices up.
For MBS investors, this has a dual effect:
- Positive Credit Effect: A stronger housing market (rising prices, lower unemployment) reduces the likelihood of mortgage defaults, improving the credit quality of the MBS pool.
- Negative Prepayment Effect: Lower rates incentivise existing homeowners to refinance their mortgages. When a homeowner refinances, their old, higher-interest loan is paid off, and that principal is returned to the MBS investor ahead of schedule. This ‘prepayment’ forces the investor to reinvest their capital at the new, lower rates, a phenomenon known as prepayment risk. This can significantly reduce the overall yield of an MBS.
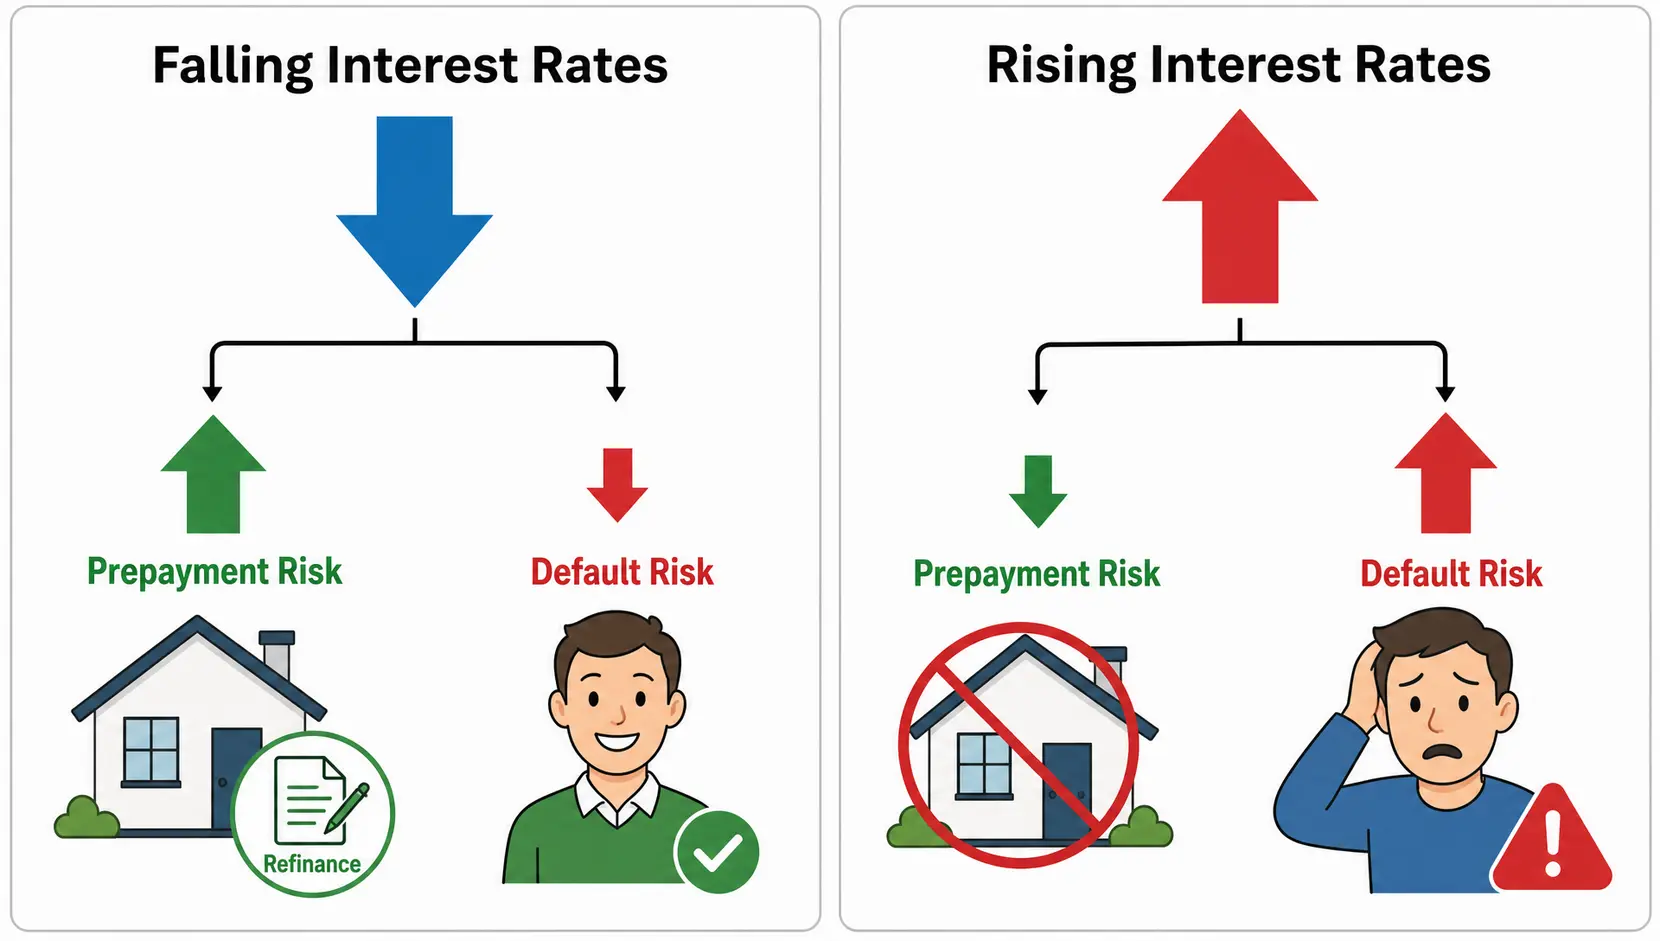
Conversely, a rising rate environment, such as the one we’ve been analysing in 2025-2026, dampens housing activity but reduces prepayment risk. This creates a different set of challenges and opportunities for MBS investors.
For a deeper analysis of this mechanism, authoritative sources like Investopedia provide excellent primers on how the Fed’s actions translate to mortgage rates.
| Scenario | Impact on Housing Market | Primary Impact on MBS |
|---|---|---|
| Falling Interest Rates | Increased affordability, higher sales, rising prices. | Increased Prepayment Risk. Lower Default Risk. |
| Rising Interest Rates | Decreased affordability, lower sales, potential price stagnation. | Decreased Prepayment Risk. Potentially Higher Default Risk if the economy slows significantly. |
Analyzing Prepayment and Default Risk Through Housing Market Trends
Beyond interest rates, the specific trends in housing data provide crucial clues for modelling MBS risks.
Default risk and prepayment risk often have an inverse relationship, and housing data helps us determine which risk is more dominant at any given point in the cycle.
When analyzing default risk, look for:
- Declining House Prices: As mentioned, this is the number one driver of defaults. Data from sources like the U.S. Department of Housing and Urban Development (HUD) can provide granular insights into regional price movements.
- Rising Unemployment: A weakening job market is a strong leading indicator for higher delinquency and default rates.
- Loose Underwriting Standards: While harder to quantify from public data, analysing the proportion of non-traditional mortgages (e.g., interest-only, adjustable-rate) can signal future credit problems.
When analyzing prepayment risk, look for:
- A large gap between current mortgage rates and the rates on outstanding loans: The greater the incentive to refinance, the faster the prepayment speeds.
- High Home Turnover: People moving homes is another major source of prepayments, as the old mortgage is paid off upon sale. Robust home sales data indicates higher prepayment activity from this source.
Government Roles and Historical Context
The US MBS market is dominated by so-called ‘Agency MBS’, which are securities issued and/or guaranteed by one of three entities: Fannie Mae, Freddie Mac, or Ginnie Mae. This government backing fundamentally alters the risk equation.
The Influence of Fannie Mae and Ginnie Mae on the MBS Market
Fannie Mae (Federal National Mortgage Association) and Freddie Mac (Federal Home Loan Mortgage Corporation) are GSEs. They do not originate loans directly but buy mortgages from lenders that conform to their standards (e.g., loan size, credit score).
They then package these loans into MBS. While their securities are not explicitly backed by the full faith and credit of the US government, there is an implicit guarantee, and they have been under government conservatorship since 2008.
Ginnie Mae (Government National Mortgage Association), in contrast, is a government-owned corporation within HUD.
As stated on their official website, Ginnie Mae’s role is to guarantee the timely payment of principal and interest on MBS backed by federally insured loans (such as FHA and VA loans). This is an explicit guarantee backed by the full faith and credit of the US government.
This distinction creates two major classes of MBS:
| Feature | Agency MBS (Fannie, Freddie, Ginnie) | Non-Agency MBS (Private-Label) |
|---|---|---|
| Credit Risk | Considered negligible due to the government/GSE guarantee. If a borrower defaults, the agency ensures investors still receive their payments. | Borne entirely by the investor. The value of the security is directly tied to the performance of the underlying, non-guaranteed mortgages. |
| Primary Risk | Interest rate and prepayment risk. | Credit/default risk is the dominant concern, alongside interest rate and prepayment risk. |
| Yield | Generally lower, reflecting the lower credit risk. | Generally higher, to compensate investors for taking on credit risk. |
| Data Focus | Focus is on interest rate forecasts and housing turnover data to model prepayments. | Intense focus on house prices, delinquency rates, and borrower credit quality is required. |
Case Study: The 2008 Financial Crisis and the Role of MBS
No discussion of the us housing market data impact on Mortgage-Backed Securities is complete without analysing the 2008 Global Financial Crisis.
The crisis was a textbook example of what happens when the link between MBS investors and housing market reality is severed by complexity and flawed assumptions.
The epicentre of the crisis was the explosion in Non-Agency MBS, specifically those backed by ‘subprime’ mortgages. These were loans made to borrowers with poor credit history.
For years, a booming housing market masked the inherent risk. Rising home prices meant that even if a subprime borrower struggled, they could easily refinance or sell the property, often for a profit, thus paying off the loan.
MBS investors, relying on flawed credit ratings and historical data that did not account for a nationwide fall in house prices, felt secure.
Frequently Asked Questions
1. What is the primary risk associated with Mortgage-Backed Securities?
As a market analyst, I’d say the ‘primary’ risk depends on the type of MBS.
For Agency MBS (backed by Ginnie Mae, Fannie Mae, or Freddie Mac), credit risk is minimal.
The dominant risks are prepayment risk (borrowers paying back their loans early, forcing reinvestment at lower rates) and interest rate risk (the security’s price falling as overall rates rise).
For Non-Agency MBS, credit risk (or default risk) is the paramount concern, as investors bear the full loss if homeowners default on the underlying mortgages.
2. How do interest rate fluctuations specifically affect MBS investments?
Interest rate movements have a powerful, multi-faceted effect. Firstly, like all fixed-income instruments, MBS prices have an inverse relationship with interest rates; when rates rise, the value of existing, lower-yielding MBS falls. This is ‘duration risk’.
Secondly, and more uniquely to MBS, falling rates dramatically increase prepayment speeds as homeowners refinance. This shortens the life of the MBS and forces investors to accept lower yields.
Conversely, rising rates decrease prepayments, extending the life of the MBS (extension risk) and locking an investor’s capital in a security that is underperforming the current market rate.
3. Are MBS a safe investment during a housing market downturn?
This requires a very nuanced answer. Agency MBS, with their government guarantee, are largely insulated from the default impact of a housing downturn. Their value will be more influenced by the corresponding central bank policy (e.g., interest rate cuts).
They can be a relative safe haven from a credit perspective. However, Non-Agency MBS are extremely vulnerable in a housing downturn. As we saw in 2008, falling house prices lead directly to higher defaults and catastrophic losses for investors in these securities.
Therefore, I would categorise Agency MBS as relatively safe, while Non-Agency MBS carry substantial risk during such periods.
Andrew Wong’s Final Thoughts
Sources & Methodology
Andrew Wong strictly relies on primary regulatory data and authoritative official information to ensure accuracy. Data cited in this guide is sourced from:
- Investopedia: Analysis of Federal Reserve Impact on Mortgage Rates
- Ginnie Mae (GNMA): Official Role and Programs
- Financial Stability Board: Risk Management Lessons from the Global Banking Crisis
- U.S. Department of Housing and Urban Development (HUD): Housing Market Indicators
- Federal Housing Finance Agency (FHFA): House Price Index Data
*Disclaimer: The content of this article represents the personal views of the author (Andrew Wong) and is for educational and reference purposes only. It does not constitute professional investment or financial advice. Trading and investing involve significant risk; proceed with caution.*
