
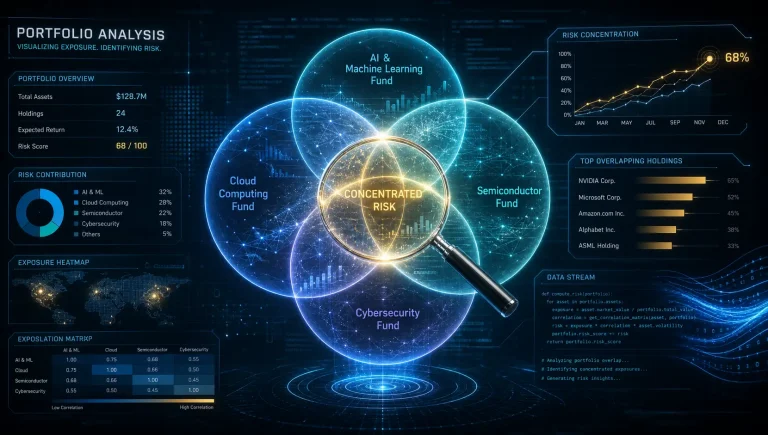
As a fund research analyst, a common pattern I observe is investors holding multiple US tech funds under the assumption of achieving broad diversification.
However, a detailed look into the underlying assets often reveals a significant concentration in the same handful of mega-cap stocks.
This guide focuses on analyzing portfolio overlap in popular US tech funds, a critical exercise for any serious investor.
We will explore methods to understand the risks associated with high portfolio overlap and find the best tools for this purpose, ensuring your portfolio’s structure is deliberate, not accidental.
Failing to conduct this analysis can lead to a false sense of security and expose you to unintended concentration risk, undermining your entire asset allocation strategy.
Why Analysing Portfolio Overlap Is Crucial for Tech Investors
Pro Tip: Analysing fund overlap is not an exercise to label funds as ‘good’ or ‘bad’. Rather, it is a quantitative diagnostic procedure. Its primary purpose is to reveal the true, underlying concentration of your capital in specific securities, which allows you to manage risk and expected returns with greater precision. A high overlap simply indicates a need for strategic review.
In the financial markets of 2026, where technology stocks continue to dominate market capitalisation, understanding the composition of your investments has never been more vital.
Many investors, in their quest for exposure to the high-growth tech sector, inadvertently acquire multiple Exchange-Traded Funds (ETFs) that, while carrying different names and expense ratios, hold nearly identical core assets.
The Illusion of Diversification: Understanding Concentration Risk in Tech
Diversification is a cornerstone of prudent investment management, designed to mitigate unsystematic risk by spreading investments across various assets.
However, purchasing several tech-focused ETFs, such as the Invesco QQQ Trust (QQQ), the Vanguard Information Technology ETF (VGT), and the Fidelity MSCI Information Technology Index ETF (FTEC), may create an illusion of diversification.
In reality, you could be repeatedly buying into the same large-cap tech giants.
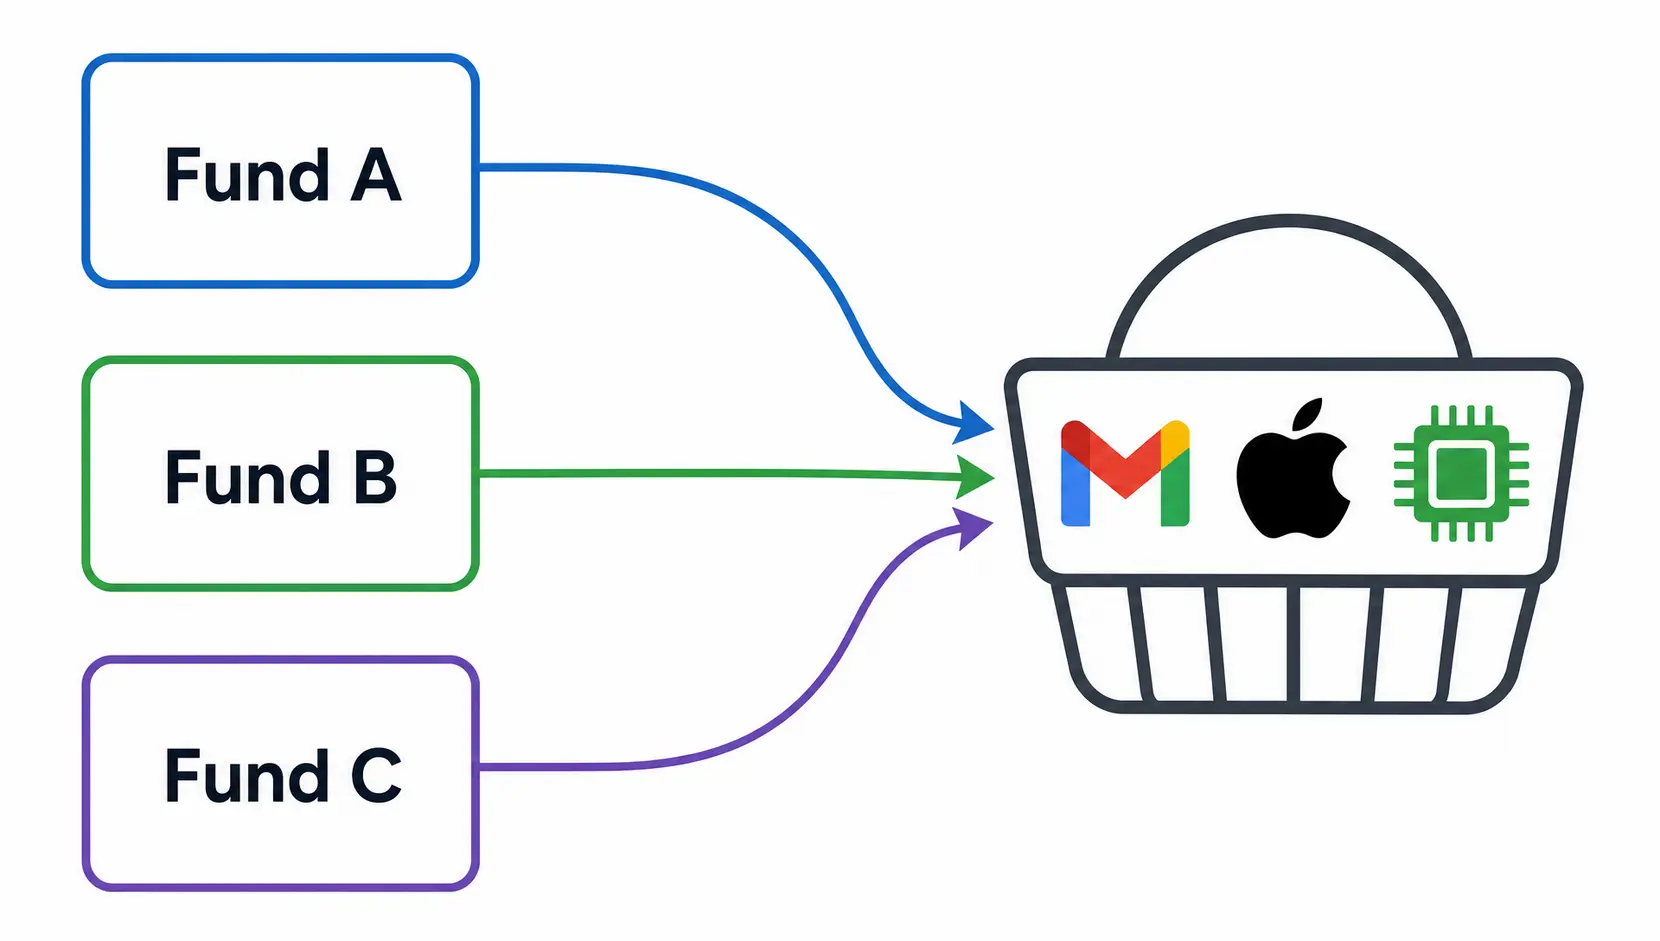
For instance, companies like Microsoft (MSFT), Apple (AAPL), and NVIDIA (NVDA) consistently feature as top holdings across the majority of US technology and even broader market indices.
When your portfolio contains multiple funds with a 40-50% overlap, your risk is not spread out; it’s magnified and tethered to the fortunes of a very small number of companies.
This is the definition of concentration risk – an exposure so significant that a downturn in a single holding could disproportionately impair your portfolio’s total value.
How Hidden Overlap Impacts Your Portfolio’s True Performance and Volatility
The practical consequence of high portfolio overlap extends beyond just risk. It directly influences your portfolio’s performance and volatility.
If several of your funds are heavily weighted towards the same stocks, their performance charts will move in near-perfect lockstep. This high correlation negates the benefits of holding multiple instruments.
Consider a scenario where the entire semiconductor industry faces a regulatory headwind or a supply chain disruption. If your tech funds all have significant weightings in semiconductor firms, your entire portfolio will suffer a synchronised decline.
A genuinely diversified portfolio, by contrast, would have complementary assets that may perform differently under the same market conditions, thereby smoothing out returns and reducing overall volatility.
This is often quantified by the Sharpe Ratio, a measure of risk-adjusted return. High internal correlation from overlap can lead to a lower Sharpe Ratio than could be achieved with a more thoughtfully constructed portfolio.
How to Analyse Your Portfolio Overlap: A Step-by-Step Guide
Summary Paragraph:
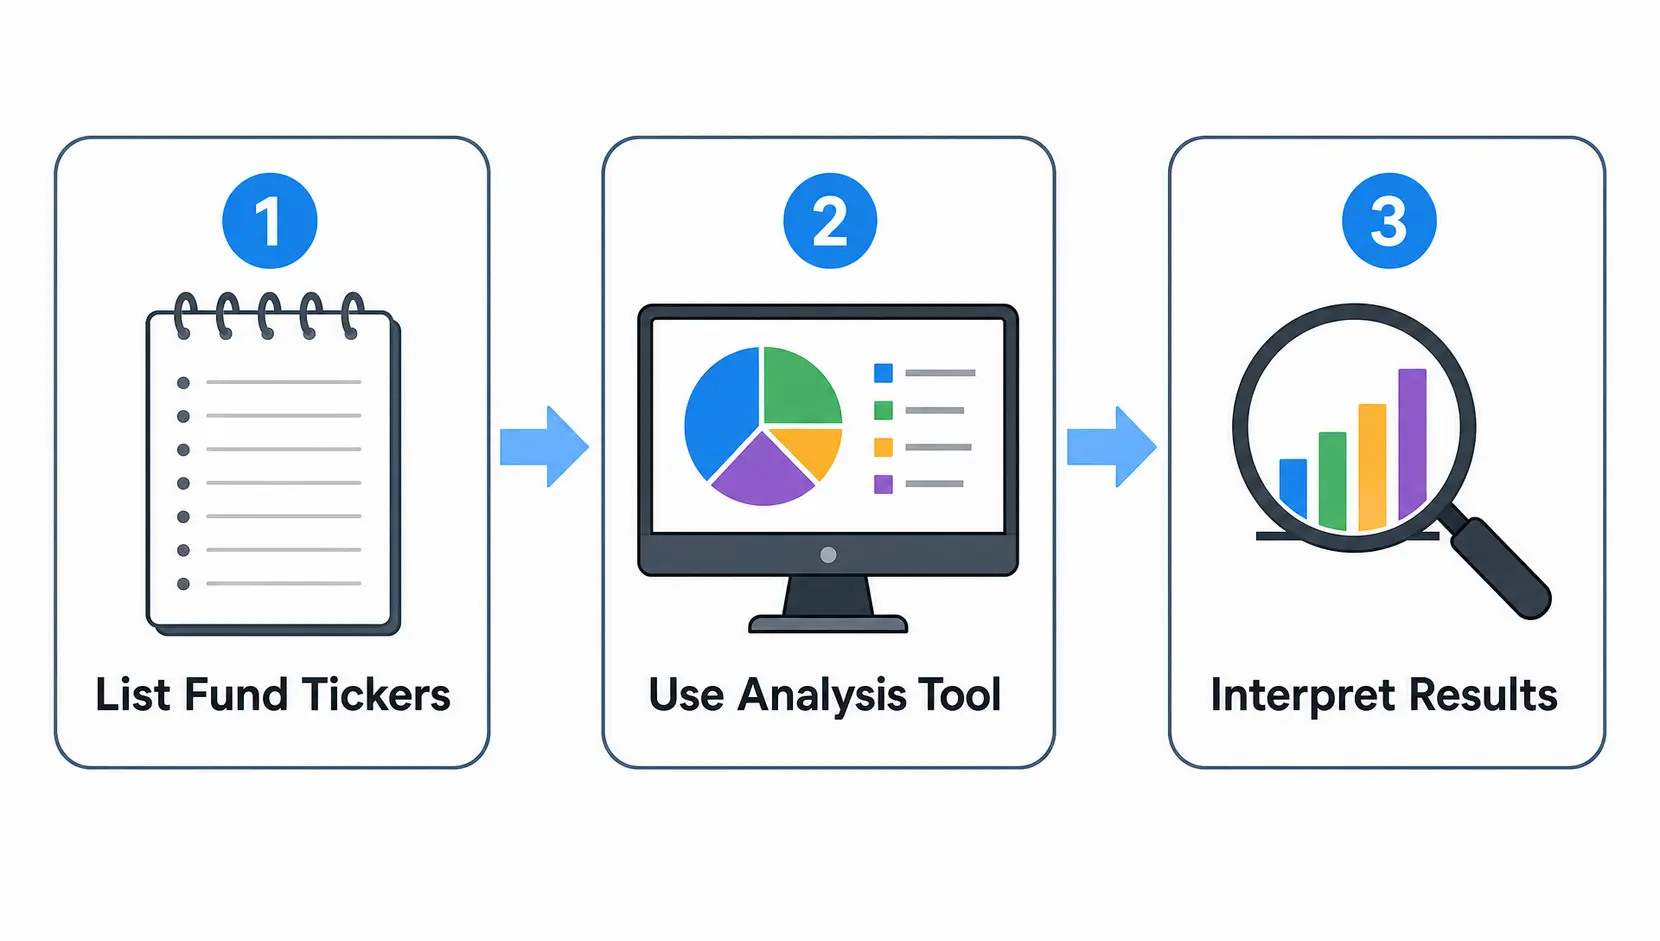
The analysis is a simple three-step process. First, compile the ticker symbols of your fund holdings. Second, input these tickers into a reliable, free online portfolio analysis tool.
Finally, interpret the output by examining the overall overlap percentage and the specific common holdings that contribute most to this figure. This data provides the foundation for any subsequent rebalancing decisions.
Step 1: Listing Your US Tech Fund Tickers (e.g., QQQ, VGT, FTEC)
Begin by compiling a simple list of the stock market ticker symbols for all the US technology funds you hold. This may include ETFs and mutual funds. Precision is key, so ensure the tickers are correct.
The most popular funds in this category that investors frequently hold together include:
- QQQ (Invesco QQQ Trust) – Tracks the NASDAQ-100 Index.
- VGT (Vanguard Information Technology ETF) – Tracks the MSCI US Investable Market Index/Information Technology 25/50.
- FTEC (Fidelity MSCI Information Technology Index ETF) – Also tracks the MSCI US Investable Market Index/Information Technology 25/50.
- Other relevant funds could include XLK (Technology Select Sector SPDR Fund) or even broader indices like SPY (SPDR S&P 500 ETF Trust) which has a significant tech weighting.
Step 2: Using the Best Free Tools for Overlap Analysis
Once you have your list of tickers, you can use several excellent and free online tools to perform the overlap analysis.
These platforms source their data from public fund disclosures and provide a clear, quantitative breakdown of portfolio similarities. One of the most effective and widely used is the ETF Research Center’s Fund Overlap tool.
You simply enter the tickers of two funds you wish to compare, and the tool generates a report detailing the percentage of overlap by weight and the specific stocks they have in common.
For analysing a whole portfolio with multiple funds, their ‘Portfolio Builder’ function is more appropriate.
You can access such a tool here: ETF Research Center Fund Overlap Tool.
Step 3: How to Interpret the Overlap Percentage and Top Common Holdings
The results page will typically present two key pieces of information:
- Overlap Percentage: This figure, shown by weight, tells you how much of the smaller fund’s portfolio is also present in the larger one. For example, a 55% overlap between QQQ and VGT means that 55% of the assets in one fund are identical to assets in the other. As a general rule of thumb, an overlap exceeding 30-40% should prompt a thorough review of the investment rationale for holding both funds.
- Top Common Holdings: The tool will list the individual stocks that both funds hold, along with their respective weightings in each fund. This is the most crucial data. Pay close attention to the ‘Top 10’ common holdings, as these are the primary drivers of your portfolio’s concentration risk.
| Comparative Analysis (H1 2026): QQQ vs. VGT | ||
|---|---|---|
| Metric | Invesco QQQ Trust (QQQ) | Vanguard Information Technology ETF (VGT) |
| Approx. Overlap by Weight | ~45-55% (Varies with market fluctuation) | |
| Index Tracked | NASDAQ-100 Index | MSCI US IMI/Info Tech 25/50 |
| Top 3 Common Holdings | 1. Microsoft (MSFT) 2. Apple (AAPL) 3. NVIDIA (NVDA) |
1. Microsoft (MSFT) 2. Apple (AAPL) 3. NVIDIA (NVDA) |
| Combined Weight of Top 3 | ~25-30% | ~40-45% |
| Key Difference | Includes top non-financial NASDAQ companies outside of the tech sector (e.g., Tesla, Costco). | Pure-play tech fund, excluding non-tech NASDAQ listings but including tech firms outside NASDAQ. More concentrated in its top holdings. |
What to Do After Discovering Significant Overlap
Summary Paragraph:
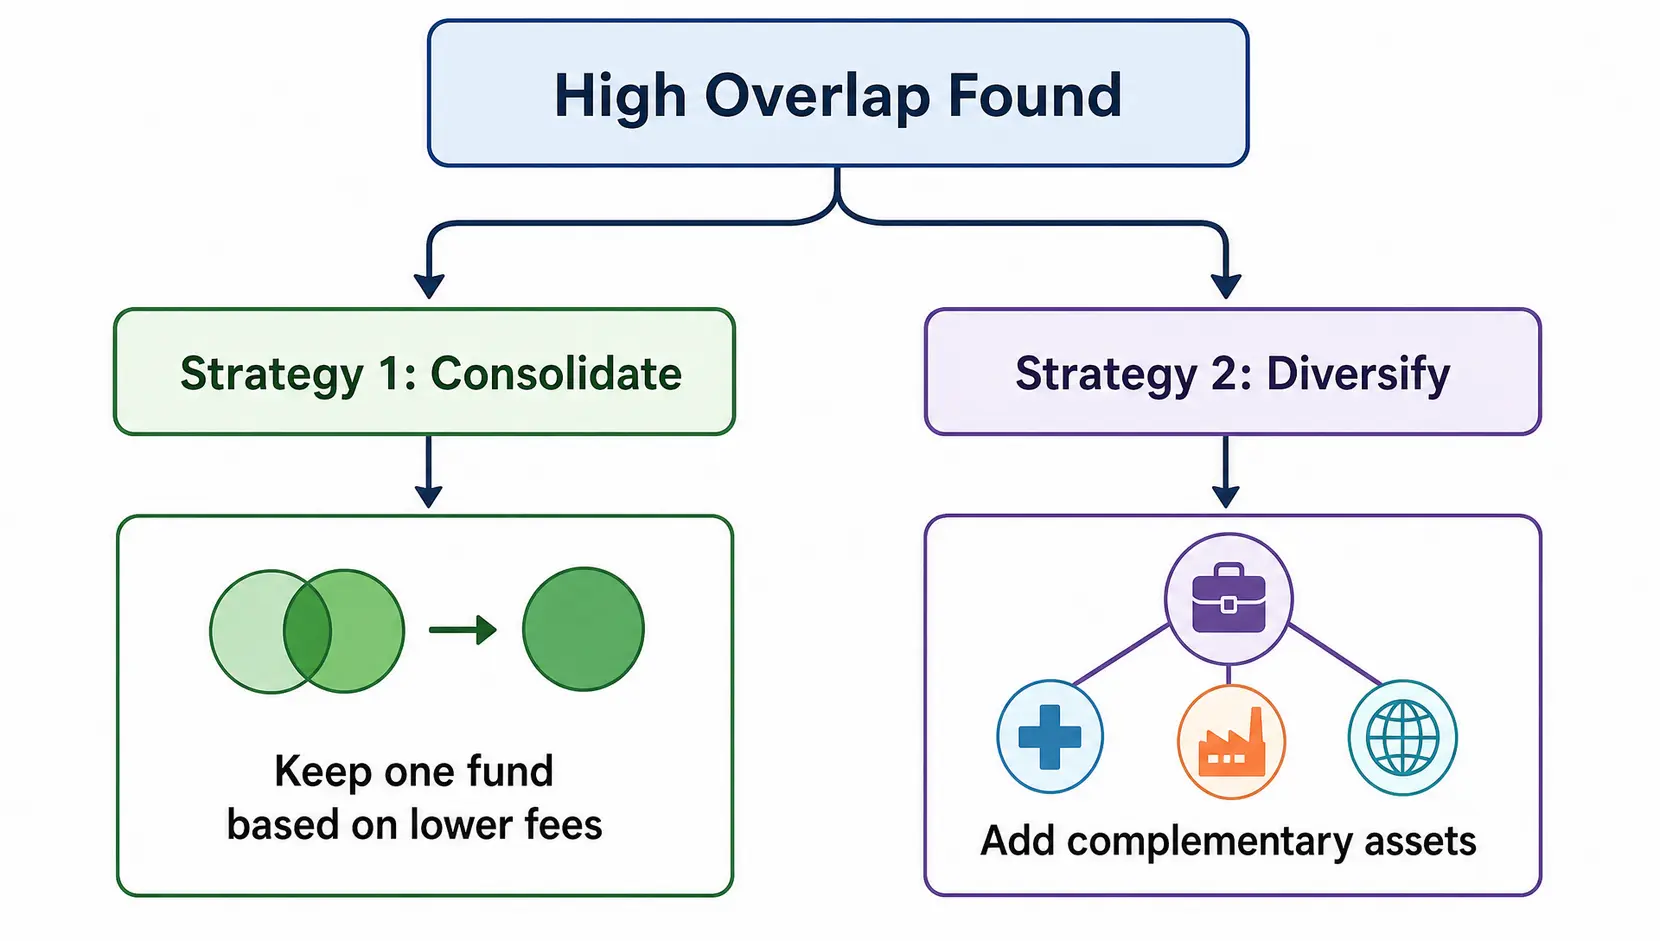
Discovering high overlap necessitates decisive action. The primary strategies involve consolidating into the single most efficient fund (based on expense ratios and tracking error) or actively seeking out non-correlated, complementary funds to add to your portfolio.
The goal is to reshape your holdings to achieve a level of diversification that aligns with your original investment objectives.
Once your analysis reveals a significant overlap, the next logical step is to re-evaluate and potentially restructure your portfolio. This is not cause for alarm but an opportunity to optimise. The appropriate action depends on your financial goals and risk tolerance.
Strategies for Rebalancing and Reducing Concentration
If two or more of your funds show a high degree of overlap (e.g., > 50%), holding both may be redundant.
The most logical strategy is often consolidation. You would sell your position in one fund and allocate the proceeds to the other, or to a completely different asset.
How do you choose which fund to keep? As a fund analyst, my evaluation is always data-driven.
I compare the overlapping funds based on three quantitative factors:
- Total Expense Ratio (TER): This is the annual fee charged by the fund. Over the long term, even a small difference in TER can have a substantial impact on your net returns. Always favour the fund with the lower expense ratio, all else being equal.
- Tracking Error: This metric indicates how well the fund tracks its benchmark index. A lower tracking error is preferable, as it means the fund’s performance is more reliably aligned with the index it’s supposed to replicate.
- Liquidity: Measured by the average daily trading volume and bid-ask spread. Higher liquidity ensures you can buy or sell the ETF quickly and at a fair price.
| Consolidation Decision Matrix (H1 2026): VGT vs. FTEC | ||
|---|---|---|
| Metric | Vanguard Information Technology ETF (VGT) | Fidelity MSCI Info Tech ETF (FTEC) |
| Index Tracked | MSCI US IMI/Info Tech 25/50 | MSCI US IMI/Info Tech 25/50 |
| Portfolio Overlap | Extremely High (~98-99%) | |
| Expense Ratio (TER) | 0.10% | 0.08% |
| Number of Holdings | ~320 | ~320 |
| Analytical Conclusion | Given that both ETFs track the same index and have almost identical portfolios, there is no logical reason to hold both. An investor should consolidate into FTEC due to its marginally lower expense ratio. This decision, while seeming minor, leads to superior net returns over the long term. | |
Choosing Complementary Funds to Improve Diversification
After consolidating redundant holdings, the next step is to improve genuine diversification. This involves selecting funds that have a low correlation to your core tech holdings.
Instead of adding another large-cap tech ETF, consider funds that provide exposure to:
- Different Sectors: Look at sectors like Healthcare (e.g., XLV), Financials (e.g., XLF), or Consumer Staples (e.g., XLP). These industries often perform differently from technology depending on the economic cycle.
- Different Geographies: If your portfolio is heavily US-centric, consider adding exposure to European (e.g., VGK) or Emerging Markets (e.g., EEM) to diversify geographically.
- Different Tech Sub-Sectors: If you wish to maintain a tech focus but want to diversify within it, look for thematic ETFs focused on niche areas with low overlap with mega-caps. Examples include funds focused on Cybersecurity (e.g., BUG), Cloud Computing (e.g., SKYY), or a broader small-cap tech ETF.
Frequently Asked Questions
1. How much portfolio overlap is considered too much?
From an analyst’s perspective, there isn’t a single ‘magic number’, as it depends on your strategy. However, a common professional guideline is that an overlap percentage exceeding 30-40% between two funds warrants a detailed review.
If the overlap is above 50%, you are likely holding redundant positions, and consolidation should be seriously considered unless you have a specific, defined reason for holding both (such as one being in a tax-sheltered account).
2. Can I check portfolio overlap for free?
Yes, absolutely. There are several high-quality, free tools available to all investors. Websites like the ETF Research Center, ETF.com, and Morningstar provide free, user-friendly portfolio analysis tools.
These platforms allow you to input your fund tickers and generate immediate, detailed reports on overlap, common holdings, and other essential metrics without any cost.
3. Does high overlap mean a fund is bad?
No, a high overlap between two funds does not imply that either fund is ‘bad’. In fact, two excellent, low-cost index funds tracking similar benchmarks will inherently have a high overlap.
The issue is not the quality of the fund, but the structure of your portfolio. Holding both is simply an inefficient allocation of capital that creates unintended concentration rather than the diversification you may have been seeking.
4. How often should I perform an overlap analysis?
A comprehensive portfolio review, including an overlap analysis, should be conducted at least annually. However, a six-month review cycle is preferable, especially in volatile market conditions.
Major index rebalancing, which can alter a fund’s composition, typically occurs semi-annually or quarterly, so a bi-annual check-up ensures your portfolio remains aligned with your long-term strategy.
William Lee’s Final Thoughts
Sources & Methodology
William Lee strictly relies on primary regulatory data and authoritative official information to ensure accuracy. Data cited in this guide is sourced from:
*Disclaimer: The content of this article represents the personal views of the author (William Lee) and is for educational and reference purposes only. It does not constitute professional investment or financial advice. Trading and investing involve significant risk; proceed with caution.*
