

Trading the US Tech 100 index requires a steady hand and a clear methodology.
Many traders are lured by its volatility, only to be overwhelmed by the noise. After more than a decade in the markets, I’ve learned that surviving, and eventually thriving, comes down to executing a well-defined plan.
This is where employing trading breakout strategies on the US Tech 100 index becomes a cornerstone of a systematic approach. We will explore several proven breakout strategies, moving beyond simple theory to practical application.
This guide is built on principles of risk management, designed to help you navigate the high-momentum environment of US Tech 100 breakout trading with greater confidence and discipline.
What is a Breakout Strategy in Index Trading?
In the context of major indices like the US Tech 100, a breakout strategy is a systematic approach to identifying and trading price movements that surpass a defined boundary.
These boundaries are typically areas of consolidation or congestion where the price has previously struggled to penetrate. A successful breakout suggests a shift in market sentiment and the potential for a sustained move, which is what we, as traders, aim to capitalise on.
Defining Breakouts, Support, and Resistance
Before executing any breakout trade, you must have a crystal-clear understanding of support and resistance. Think of them as price floors and ceilings.
- Support: A price level where a downtrend is expected to pause due to a concentration of demand or buying interest. As the price drops towards support, it becomes cheaper, and buyers are more inclined to step in, thus ‘supporting’ the price and preventing it from falling further.
- Resistance: The opposite of support. It’s a price level where an uptrend is expected to pause temporarily, due to a concentration of selling interest. As the price rises towards resistance, sellers become more eager to take profits, ‘resisting’ the price from rising further.
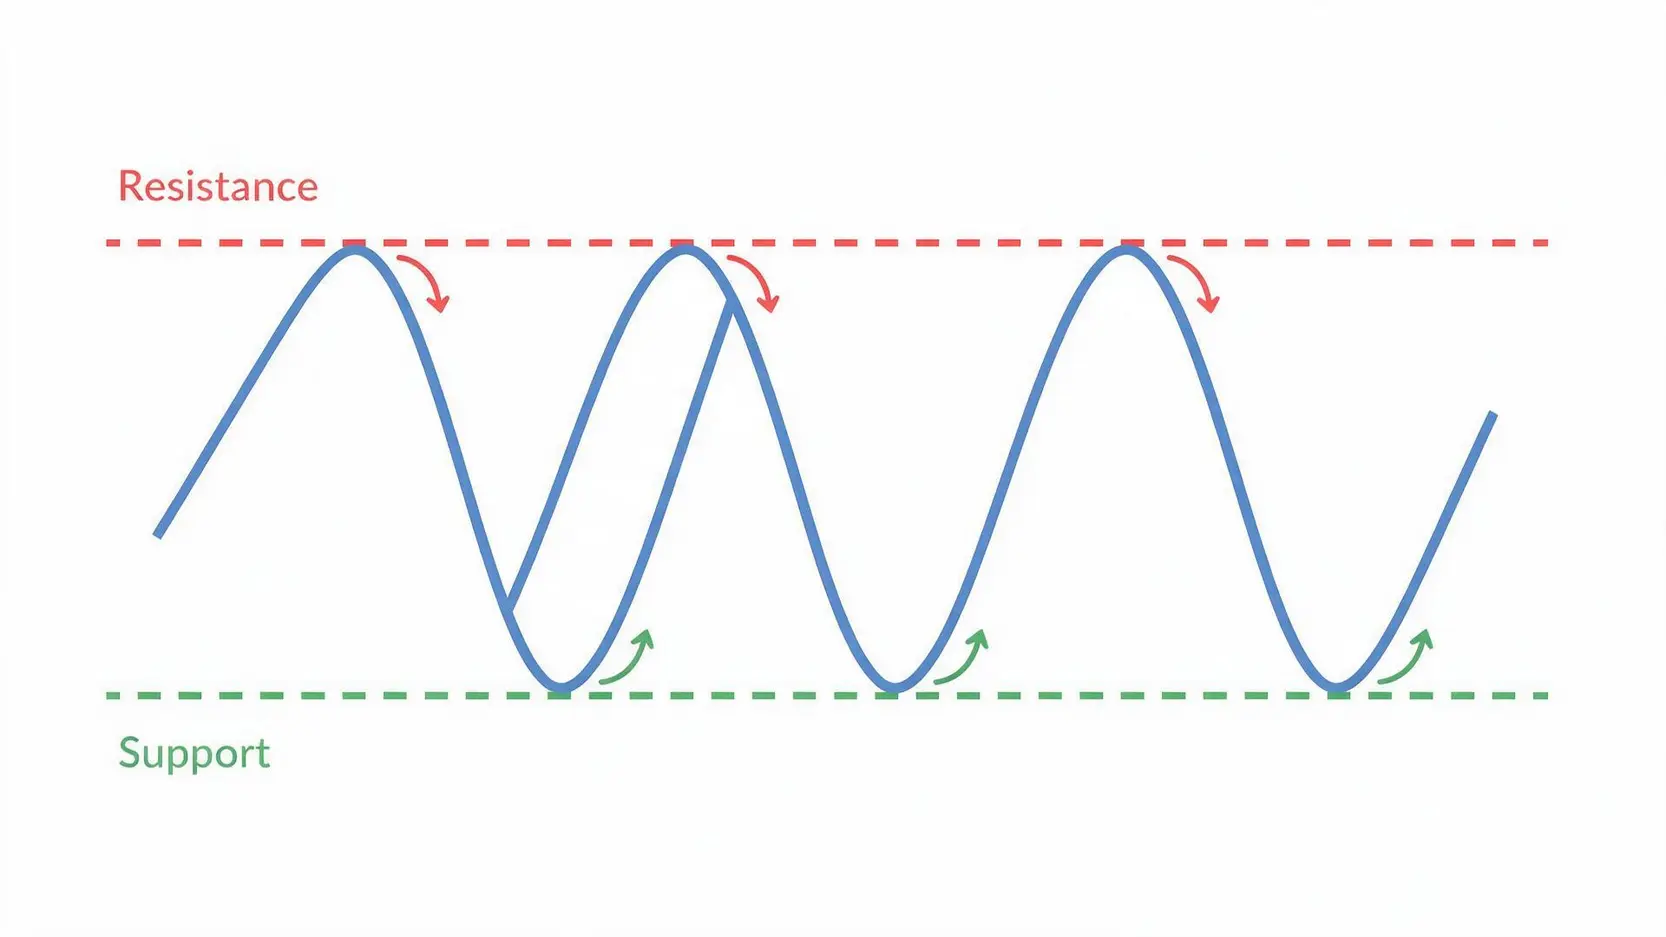
A breakout occurs when the price ‘breaks’ through one of these levels—either above resistance or below support. This action, especially when accompanied by an increase in trading volume, signals that the existing market balance has been disrupted.
Authoritative sources like Investopedia provide a solid foundation for these concepts, which are the bedrock of technical analysis. For a deeper dive, I recommend reviewing their materials on Support and Resistance Basics.
Why the US Tech 100 is Prime for Breakout Trading
The US Tech 100, representing the 100 largest non-financial companies on the Nasdaq, is uniquely suited for breakout strategies for several reasons:
- High Volatility and Liquidity: The index is dominated by high-growth technology stocks, which are inherently more volatile than blue-chip industrial stocks. This volatility creates frequent and substantial price swings, providing numerous breakout opportunities. High liquidity ensures that traders can enter and exit positions with minimal slippage.
- News-Driven Sensitivity: Tech stocks are highly sensitive to macroeconomic data (like inflation reports and central bank announcements), earnings reports, and sector-specific news. These events act as catalysts, often providing the necessary momentum to shatter established support and resistance levels.
- Clear Trend-Following Behaviour: When the US Tech 100 decides on a direction, it tends to trend strongly. This characteristic is ideal for breakout traders, as the goal is to ride the subsequent momentum for as long as it is profitable. Its nature makes it a fertile ground for trading indices with a momentum-based approach.
Core Breakout Strategies for the US Tech 100
Let’s move from the theoretical to the practical. While there are dozens of breakout variations, I find that focusing on a couple of robust, time-tested methods yields the best results.
These strategies provide a clear framework for entry, exit, and risk management.
The Opening Range Breakout (ORB): Capturing Early Momentum
The ORB is a classic day trading strategy that aims to capitalise on the initial volatility of a trading session. The first 15 to 60 minutes of the US market open often set the tone for the rest of the day, as institutional orders are filled and the market digests overnight news.
The Core Logic:
- Define the Opening Range: At the start of the main trading session (e.g., 9:30 AM EST), you wait for a specific period to pass. This could be the first 15 minutes, 30 minutes, or even the first hour. A 30-minute opening range is often a good balance for the US Tech 100.
- Mark the High and Low: Identify the highest high and the lowest low price within that defined opening range. These two points now act as your immediate support and resistance levels.
- Wait for the Breakout: An entry signal is triggered when a full candle closes decisively above the opening range high (for a long/buy trade) or below the opening range low (for a short/sell trade).
- Set Targets and Stops: The stop-loss is typically placed on the opposite side of the range. For example, on a long breakout, the stop-loss would go just below the opening range low. Take-profit targets can be set using a fixed risk-reward ratio (e.g., 1.5:1 or 2:1) or by using trailing stops.
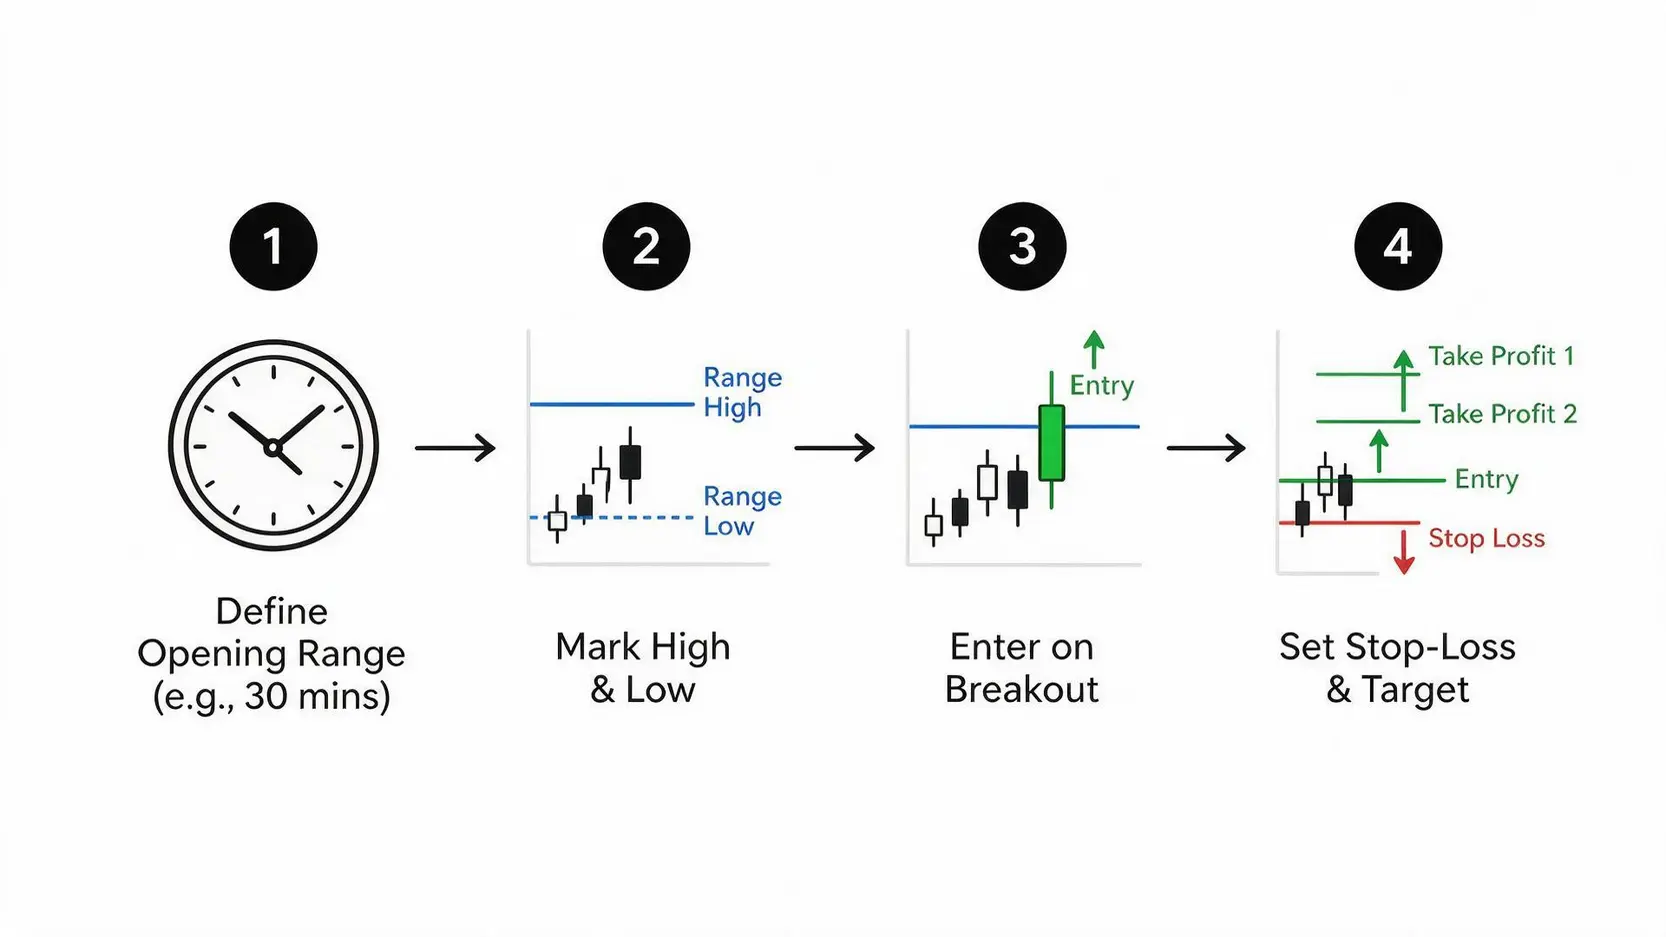
This Opening Range Breakout strategy is powerful because it’s purely mechanical and removes emotional decision-making from the most volatile part of the day.
The Heikin-Ashi & ATR Strategy for Smoother Trend Identification
While the ORB is a session-specific strategy, the Heikin-Ashi and Average True Range (ATR) combination is a continuous trend-following method. It’s particularly useful for filtering out the ‘noise’ of the US Tech 100 and focusing on the underlying trend.
The Core Logic:
- Heikin-Ashi for Trend Clarity: Heikin-Ashi (HA) candles, which mean ‘average bar’ in Japanese, modify the standard candlestick chart. They average price data to create a smoother-looking chart that more clearly shows trends and reversals. A series of green HA candles with no lower wicks indicates a strong uptrend, while a series of red HA candles with no upper wicks signifies a strong downtrend.
- ATR for Volatility-Based Stops: The Average True Range (ATR) indicator measures market volatility. It doesn’t show trend direction, but it is invaluable for setting dynamic, volatility-adjusted stop-losses. In a highly volatile market, your stop needs to be wider to avoid being prematurely taken out by random noise. In a quiet market, a tighter stop is more appropriate.
Putting It Together: A common strategy involves using a moving average (e.g., 50-period EMA) to establish the overall trend direction. You only look for long entries when the price is above the EMA and for short entries when it is below. You then use the Heikin-Ashi candles for your entry signal—for instance, waiting for two consecutive green HA candles to form above the EMA. Your initial stop-loss is then placed at a multiple of the ATR (e.g., 2x ATR) below your entry price. This powerful combination of a Heikin-Ashi and ATR strategy helps you stay in trades longer during strong trends.
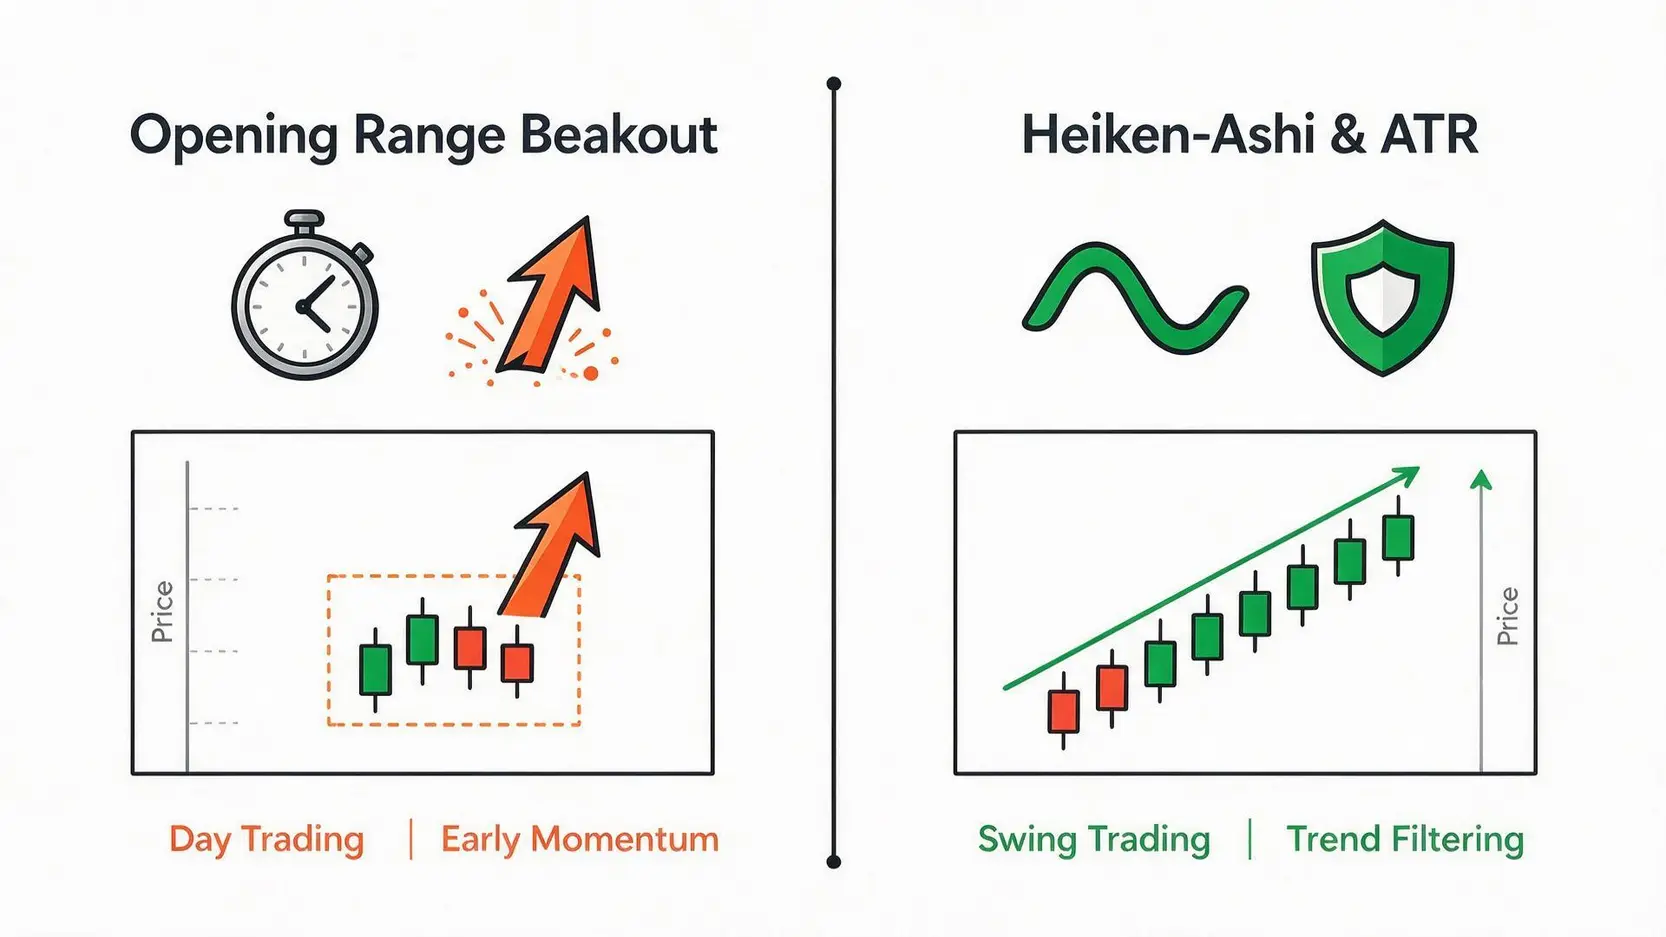
| Feature | Opening Range Breakout (ORB) | Heikin-Ashi & ATR Strategy |
|---|---|---|
| Best For | Day traders looking to capture session-opening momentum. | Swing or position traders aiming to ride sustained trends. |
| Primary Tools | Price Action, Support/Resistance from opening period. | Heikin-Ashi candles, ATR indicator, Moving Average. |
| Complexity | Low. Mechanically simple to identify and execute. | Medium. Requires understanding of multiple indicators. |
| Risk Profile | Defined risk with stop on the other side of the range. Susceptible to false breakouts. | Dynamic risk based on volatility (ATR). Helps avoid premature stop-outs in choppy markets. |
Executing Your Trade: A Step-by-Step Guide
Knowing the strategy is only half the battle. The other half is execution. This is where most aspiring traders fail. They second-guess their signals, move their stop-losses, or take profits too early out of fear.
Identifying Valid Entry and Exit Signals
A true breakout has conviction. A false one is a trap. Here are a few ways I’ve learned to differentiate them:
- Volume Confirmation: A breakout on high, climactic volume is far more reliable than one on low volume. High volume indicates that large, institutional players are participating in the move, giving it legitimacy.
- Candlestick Pattern: Look at the candle that breaks the level. Is it a long, powerful Marubozu candle that closes near its high (for an uptrend)? Or is it a weak candle with long wicks, indicating indecision? The character of the breakout candle itself is a vital piece of information.
- The ‘Break and Retest’: A classic and often more conservative entry method is to wait for the price to break a level and then return to ‘retest’ it from the other side. For example, if the price breaks above a resistance level, that level should now theoretically act as support. A successful retest, where the price bounces off this new support, provides a high-probability entry point.
Setting Effective Stop-Loss and Take-Profit Orders
Your stop-loss is your survival tool. It is the single most important order you will place. It defines your maximum acceptable loss on a trade and prevents a single bad decision from wiping out your account.
Stop-Loss Placement:
- Structure-Based: Place your stop on the other side of a significant price structure. For an ORB long trade, this is the opening range low. For a standard breakout, it might be below the most recent swing low.
- Volatility-Based (ATR): As discussed, using a multiple of the ATR (e.g., 2x or 2.5x ATR) creates a dynamic stop that adapts to the market’s current volatility. This is my preferred method for trend-following trades as it gives the trade room to breathe.
Take-Profit Placement:
- Fixed Risk:Reward: The simplest method. If your stop-loss represents a 50-point risk, a 2:1 risk:reward ratio would place your take-profit 100 points from your entry.
- Next Major Structure: Identify the next significant support or resistance level on your chart and place your take-profit just before it.
- Trailing Stop: For strong trends, a trailing stop (which can be based on a moving average or an ATR multiple) allows you to lock in profits while giving the trade the potential for unlimited upside.
| Stop-Loss Method | Pros | Cons |
|---|---|---|
| Percentage-Based | Simple to calculate. | Ignores market volatility and structure; often arbitrary. |
| Volatility-Based (ATR) | Adapts to current market conditions; reduces noise-based stop-outs. | Can result in very wide stops during high volatility. |
| Structure-Based | Based on logical price barriers; defines where your trade idea is proven wrong. | Levels can be subjective; requires clear identification of swing points. |
Frequently Asked Questions
1. What are the best times to trade breakouts on the US Tech 100?
From my experience, the highest probability periods are the first two hours of the New York trading session (9:30 AM – 11:30 AM EST) and the hour leading into the close (3:00 PM – 4:00 PM EST).
The opening is driven by an influx of volume and news, while the close often sees end-of-day positioning and can feature strong, decisive moves.
2. How reliable are breakout strategies for the US Tech 100?
No strategy is 100% reliable. The reliability of a breakout strategy depends heavily on the market context (trending vs. ranging), your execution discipline, and your risk management. In a strongly trending market, breakout strategies can be exceptionally profitable.
In a choppy, range-bound market, they will lead to a series of small losses from false breakouts. The key is to have a system that makes more on winning trades than it loses on losing trades.
3. Which indicators are essential for identifying breakouts?
At a minimum, you need to be proficient with volume analysis. Volume confirms interest. Beyond that, the Average True Range (ATR) is essential for risk management and setting appropriate stop-losses in a volatile instrument like the Tech 100.
While not for identification, indicators like the RSI or MACD can be used to gauge momentum or spot divergences that may warn of a false breakout.
Danny’s Final Thoughts
Trading breakout strategies on the US Tech 100 index is a game of patience and discipline. It’s not about being right on every single trade; it’s about having a system with a positive expectancy and executing it flawlessly over time.
I’ve survived flash crashes and market meltdowns not because I’m a perfect trader, but because I am a disciplined risk manager. The strategies discussed here are not a holy grail. They are a framework.
Your success will be determined by your ability to adapt them, manage your risk, and control your own emotions in the face of uncertainty. Start small, test everything, and remember: the goal is not to win one trade, but to survive and prosper in the long game.
Sources & Methodology
Danny strictly relies on primary regulatory data and authoritative official information to ensure accuracy. Data cited in this guide is sourced from:
*Disclaimer: The content of this article represents the personal views of the author (Danny) and is for educational and reference purposes only. It does not constitute professional investment or financial advice. Trading and investing involve significant risk; proceed with caution.*
