

As a market analyst, I’ve observed that few relationships are as fundamental to global economics as the one between crude oil prices and the U.S. energy sector.
For traders and investors, analyzing the correlation between crude oil and the US energy sector is not just an academic exercise; it’s a critical component of risk management and opportunity identification.
This dynamic dictates the profitability of multinational corporations, influences investment flows, and ultimately impacts consumer costs.
Understanding the nuances of how crude oil prices really affect the US energy sector, especially in the context of the post-2020 energy transition and geopolitical shifts, is paramount for anyone exposed to this volatile market.
This analysis will dissect that very relationship for 2026.
Understanding the Core Dynamics: Crude Oil vs. The Energy Sector
The linkage appears straightforward on the surface: higher crude oil prices should equate to a healthier, more profitable energy sector.
This holds true for a significant portion of the industry, particularly the upstream segment, which includes exploration and production (E&P) companies.
Their entire business model is predicated on the price they receive for the commodity they extract. However, the sector’s response is far from uniform, and a deeper analysis reveals a far more intricate picture.
How Oil Price Fluctuations Directly Impact Energy Stocks and Investments
When West Texas Intermediate (WTI) or Brent crude prices trend upwards, the immediate market reaction is an inflow of capital into energy stocks. E&P companies like ExxonMobil, Chevron, and ConocoPhillips see their projected earnings revised upwards.
This leads to several key outcomes:
- Increased Capital Expenditure (CAPEX): With higher anticipated revenue, companies are more willing to invest in new drilling projects, advanced extraction technology, and exploration of new reserves. This boosts the oilfield services sub-sector, including firms like Schlumberger and Halliburton.
- Enhanced Investor Sentiment: Rising prices attract both institutional and retail investors, driving up equity values. This is often magnified by passive investment vehicles like the Energy Select Sector SPDR Fund (XLE), which sees significant inflows.
- Dividend Hikes and Share Buybacks: Stronger cash flows empower companies to return more capital to shareholders, further increasing the appeal of these stocks.
The Ripple Effect: From Upstream Production Costs to Downstream Consumer Prices
The impact of a crude oil price change cascades through the entire energy value chain.
While upstream producers celebrate higher prices, downstream companies—those involved in refining crude into petroleum products like gasoline and jet fuel—face a different reality.
Their profitability is determined by the ‘crack spread,’ the margin between the price of crude oil and the price of the products they sell.
A rapid surge in crude costs can compress this spread if the pass-through to consumers is delayed or resisted, temporarily hurting refiner profits.
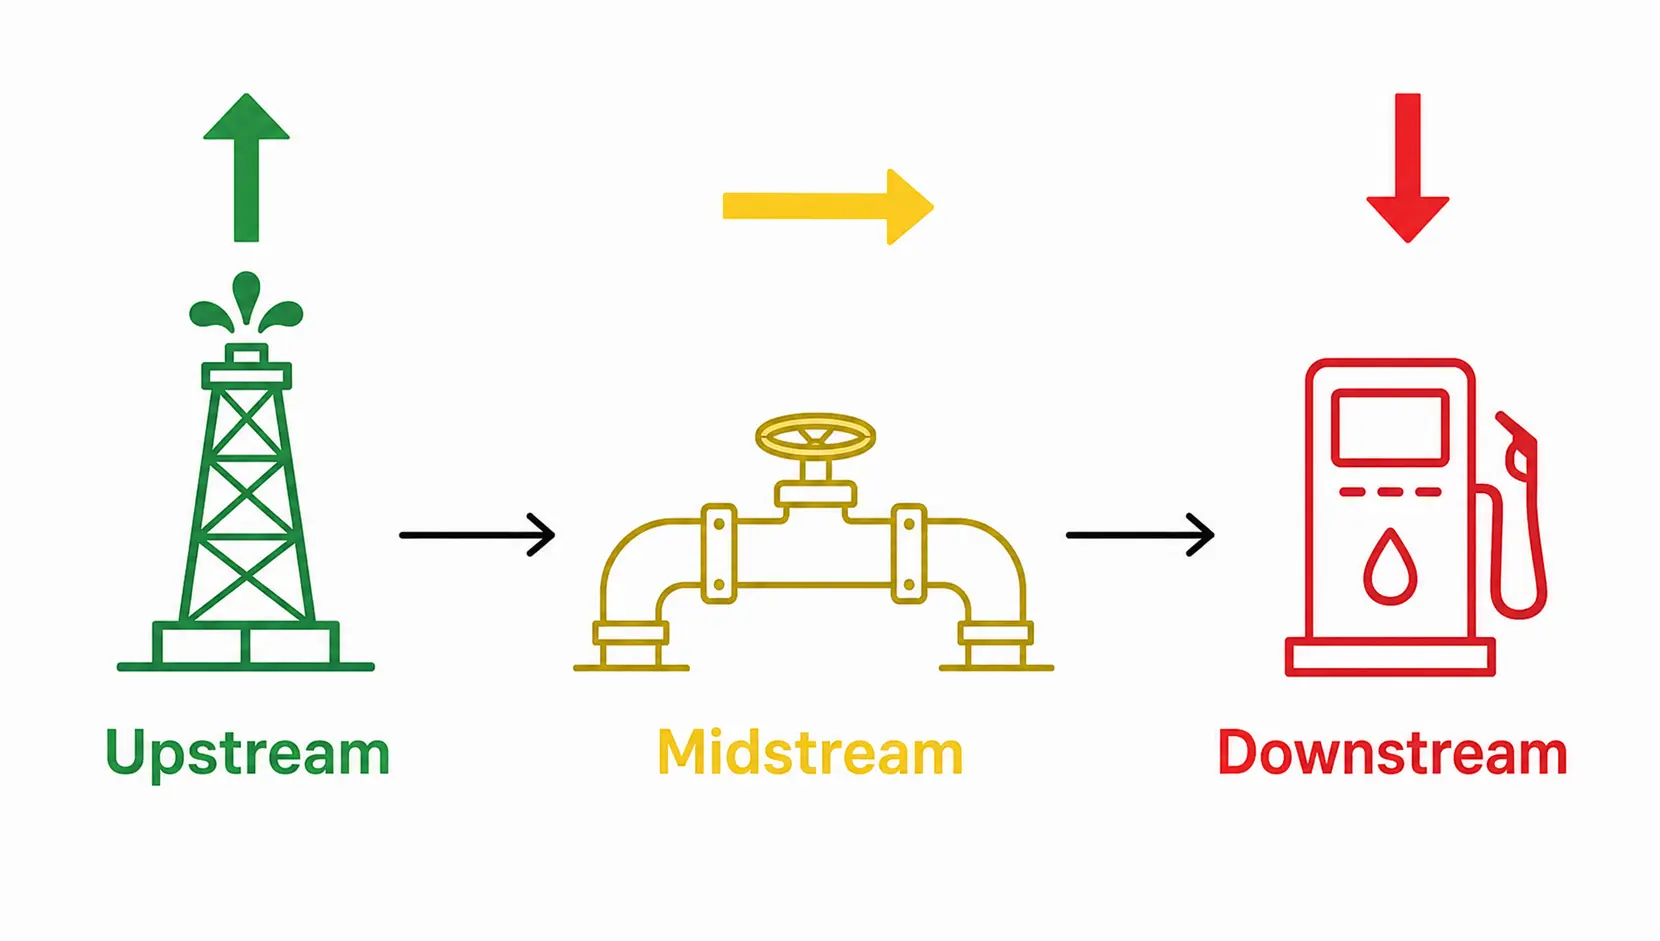
| Sector Segment | Impact of Rising Crude Oil Prices | Primary Profit Driver |
|---|---|---|
| Upstream (E&P) | Highly Positive | Price of extracted crude oil |
| Midstream (Pipelines/Storage) | Moderately Positive | Fee-based, dependent on volume |
| Downstream (Refiners) | Mixed/Potentially Negative | Crack Spread (Refining Margin) |
| Integrated Majors | Generally Positive | Diversified model balances segment volatility |
Key Factors Moderating the Evolving Crude Oil Correlation
Assuming a static, one-to-one relationship between oil and the energy sector is a mistake I often see retail traders make. The macroeconomic landscape of 2026 is vastly different from that of 2006.
Several powerful forces are actively moderating and, in some cases, weakening this traditional correlation.
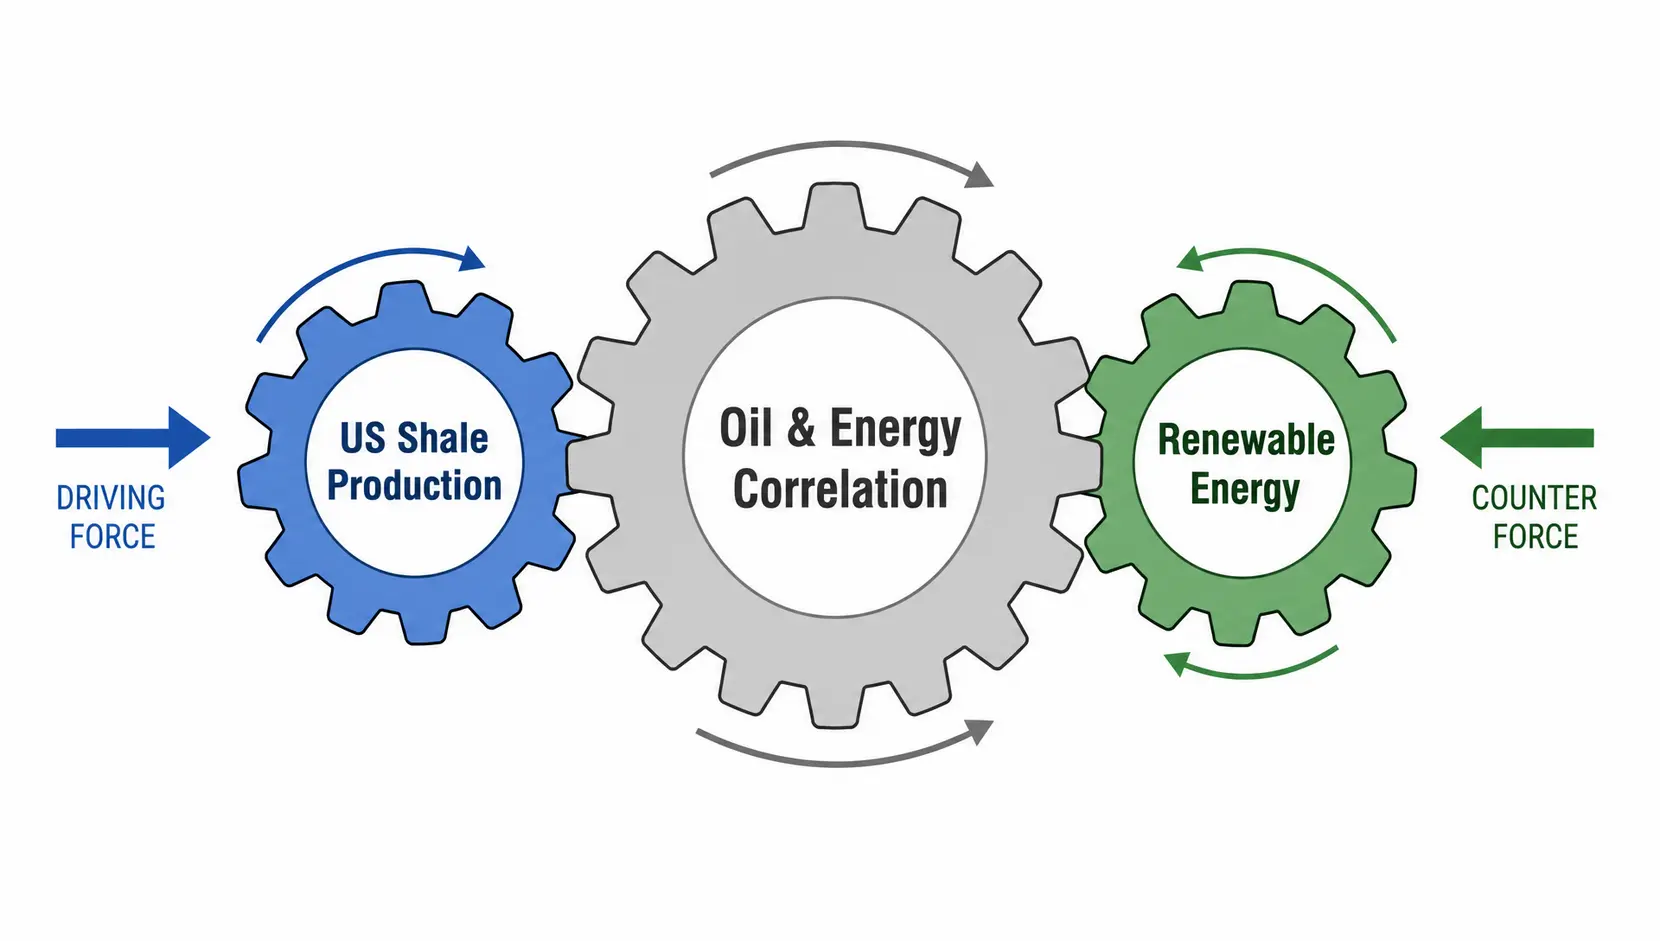
The Impact of US Shale Revolution and Increased Domestic Production
The rise of hydraulic fracturing and horizontal drilling has fundamentally reshaped the U.S. energy posture.
By transforming the nation from a major importer to a net exporter of petroleum, the shale boom has created a powerful buffer against global price shocks. Previously, a supply disruption in the Middle East would unequivocally harm the U.S. economy.
Today, while consumers still face higher gasoline prices, the pain is partially offset by immense profits and job growth in states like Texas, North Dakota, and Pennsylvania.
This has made the U.S. energy sector a beneficiary of higher global prices, a complete inversion of the previous dynamic.
The Growing Influence of Renewable Energy and Natural Gas
The second major moderating factor is the diversification of the energy mix. While crude oil dominates headlines, natural gas has become the primary source for U.S. electricity generation.
Furthermore, significant government and private sector investment continues to flow into wind, solar, and battery storage. As these renewable sources constitute a larger percentage of the grid, the overall economy’s sensitivity to oil price volatility decreases.
An energy utility with a diverse portfolio of natural gas and renewable assets is far more insulated from an oil price spike than one wholly reliant on fossil fuels.
This trend is causing a slow but steady decoupling between the broader Utilities sector and the pure-play Oil & Gas sector.
Economic and Financial Market Perspectives on the Oil-Energy Link
To fully grasp the correlation, we must look beyond physical barrels and analyse the financial instruments and macroeconomic forces that govern prices.
The market is not just a collection of producers and consumers; it is a global web of traders, speculators, and asset managers expressing their views on the economy.
The Role of the US Dollar and Global Macroeconomic Trends
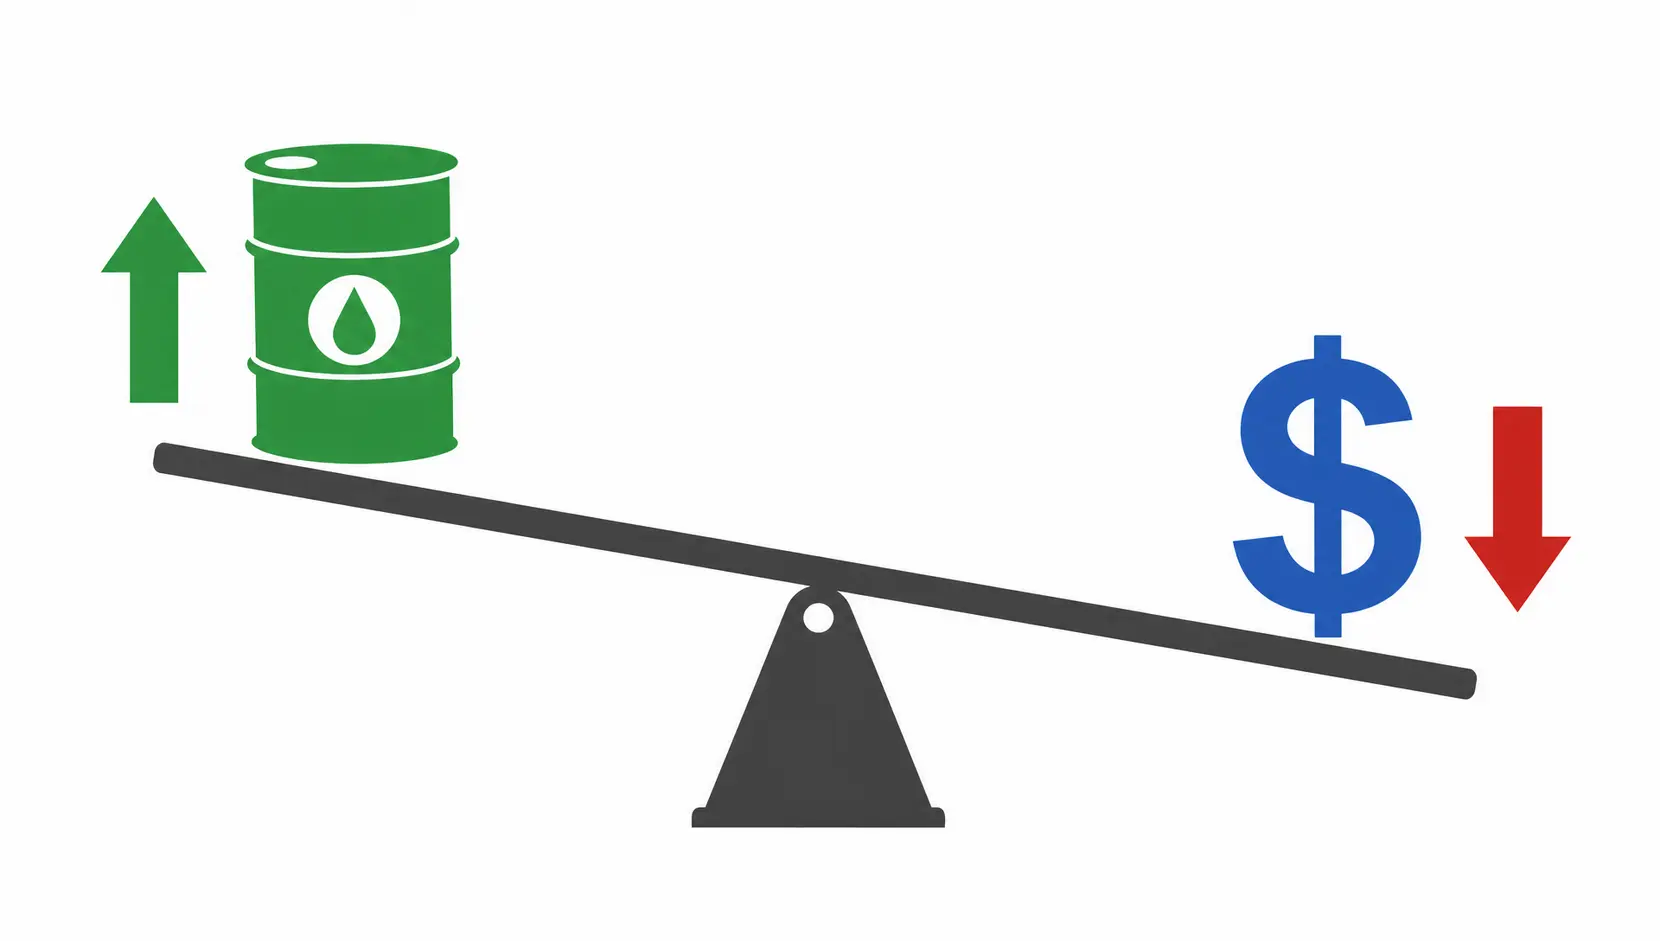
The inverse correlation between the US dollar and crude oil is a cornerstone of commodities analysis. When the Federal Reserve pursues a hawkish monetary policy, leading to a stronger dollar, it tends to weigh on crude prices.
For an investor in Malaysia or the UK, a rising dollar makes each barrel of oil more expensive in their local currency, thus curbing demand. Conversely, a dovish Fed and a weaker dollar can provide a tailwind for oil prices.
Therefore, my analysis of the energy sector always includes a thorough forecast of U.S. monetary policy and its likely effect on the DXY.
Analyzing the Link in Financial Futures and Derivatives Markets
The futures market provides a powerful lens into market expectations. The shape of the futures curve—whether in ‘contango’ (future prices higher than spot) or ‘backwardation’ (future prices lower than spot)—reveals collective sentiment about future supply and demand.
Large speculative net-long positions in WTI futures can signal bullish sentiment, often preceding a rally in both crude and energy stocks. However, these financial flows can also create volatility.
A sudden unwinding of speculative positions can trigger a sharp price drop, even if physical market fundamentals remain unchanged. Therefore, monitoring the weekly Commitment of Traders (COT) report is essential for any serious energy market participant.
| Factor | Impact on Crude-Energy Correlation | Rationale |
|---|---|---|
| Strengthening US Dollar | Weakens (Pushes Oil Price Down) | Makes dollar-denominated oil more expensive globally, reducing demand. |
| Rising US Shale Production | Strengthens & Complicates | US energy sector profits more from high prices, but also contributes to global supply, capping price upside. |
| Growth in Renewable Energy | Weakens | Reduces overall economic dependence on oil, decoupling broader market performance from crude prices. |
| Geopolitical Supply Shock | Strengthens | Price spike immediately flows to producer revenues, reinforcing the positive correlation. |
Frequently Asked Questions
1. What is the typical correlation between oil prices and the US dollar?
Historically, there is a statistically significant inverse correlation. When the US dollar strengthens against other major currencies, the price of crude oil tends to fall, and vice versa. This is because oil is priced in US dollars globally.
A stronger dollar makes oil more expensive for countries using other currencies, which can dampen demand and lead to lower prices.
2. How does the stock market generally react to changes in crude oil prices?
The general stock market (e.g., the S&P 500) has a complex and often ambivalent reaction. Sharply rising oil prices can be a negative signal, as they increase input costs for many industries (transportation, manufacturing) and squeeze consumer discretionary spending.
However, a moderate rise in oil prices driven by strong global economic growth can be viewed positively.
The energy sector itself, being a component of the market, will typically react positively to rising oil prices, sometimes acting as a hedge within a diversified portfolio during inflationary periods.
3. Has the US becoming a net exporter of energy changed its relationship with crude prices?
Yes, profoundly. Before the shale revolution, the US was a net importer, so high oil prices acted as a tax on the economy.
Now, as a net exporter, high prices, while still hurting consumers at the pump, generate significant revenue, profit, and employment in the domestic energy industry.
This has created a new dynamic where the economic benefits of high prices partially offset the consumer costs, making the overall US economy more resilient to global oil price shocks than it was 20 years ago.
4. How do renewable energy sources affect the correlation?
The growth of renewable energy acts as a long-term dampening force on the correlation. As solar, wind, and other non-fossil fuel sources make up a larger share of the energy mix, the economy’s overall dependence on crude oil diminishes.
This means that fluctuations in oil prices have a progressively smaller impact on overall economic activity and electricity prices, leading to a gradual decoupling of the broader economy’s health from the price of oil.
Andrew Wong’s Final Thoughts
Sources & Methodology
Andrew Wong strictly relies on primary regulatory data and authoritative official information to ensure accuracy. Data cited in this guide is sourced from:
*Disclaimer: The content of this article represents the personal views of the author (Andrew Wong) and is for educational and reference purposes only. It does not constitute professional investment or financial advice. Trading and investing involve significant risk; proceed with caution.*
